Real numbers from a real villa. Twenty months of actual performance, January 2025 to August 2026, from a two-bedroom villa we manage in Bingin: occupancy, margins, expense ratios and what the owner actually keeps. That is every month since the villa opened. No projections. No pro formas. The same data we send to the owner each month.
All figures in this article are presented in USD for international readability. Cabo Bali complies with Indonesian currency regulations; all villa rental transactions are priced and settled in Indonesian Rupiah (IDR). USD figures are converted at the IDR bookkeeping rate documented in each monthly owner report.
Written by Rissa Prima, Digital Marketing Manager, Cabo Bali. Last updated 27 September 2026 · 12 min read.
Own a villa in Bali? See how Cabo manages villas end to end →
On this page
- Key Numbers at a Glance
- Who This Analysis Is For
- Quick answer
- What We Projected vs What Actually Happened
- Who We Are and Why That Matters for This Article
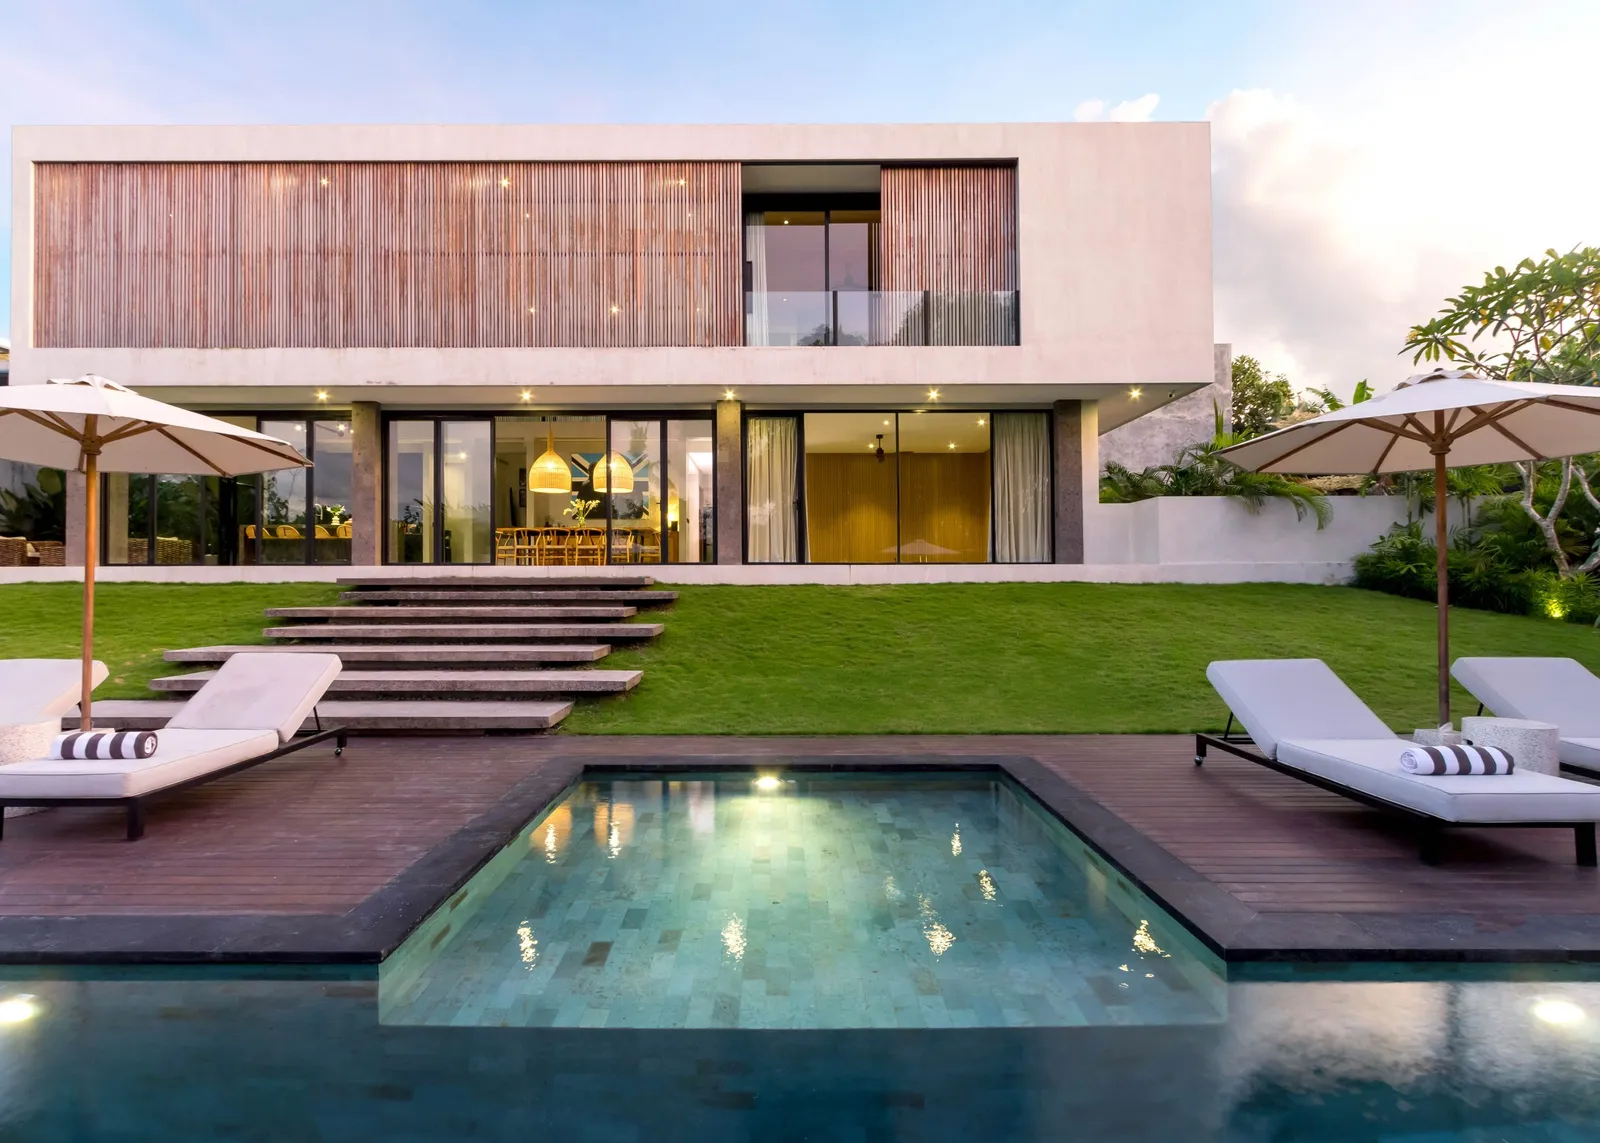
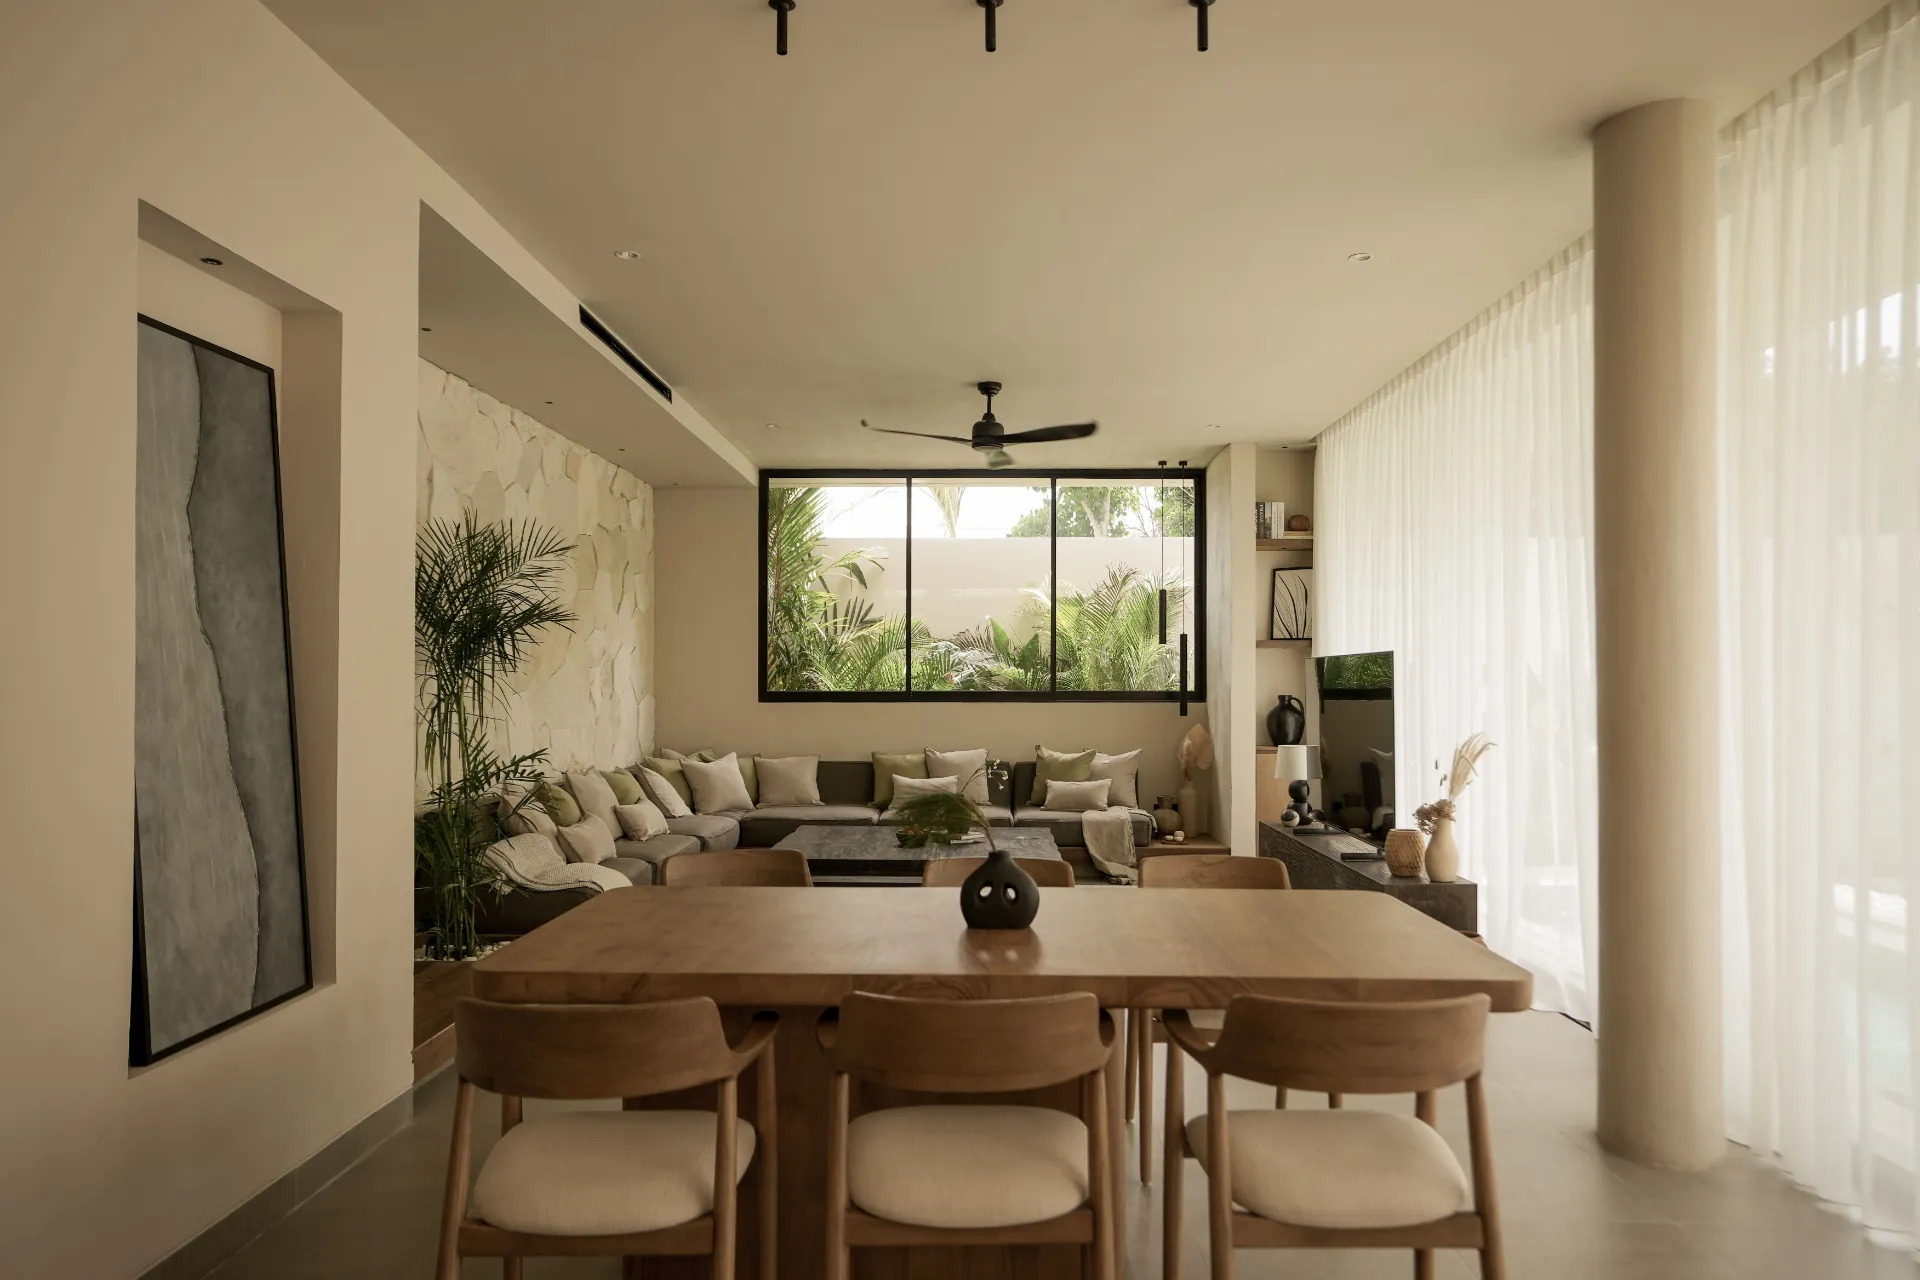
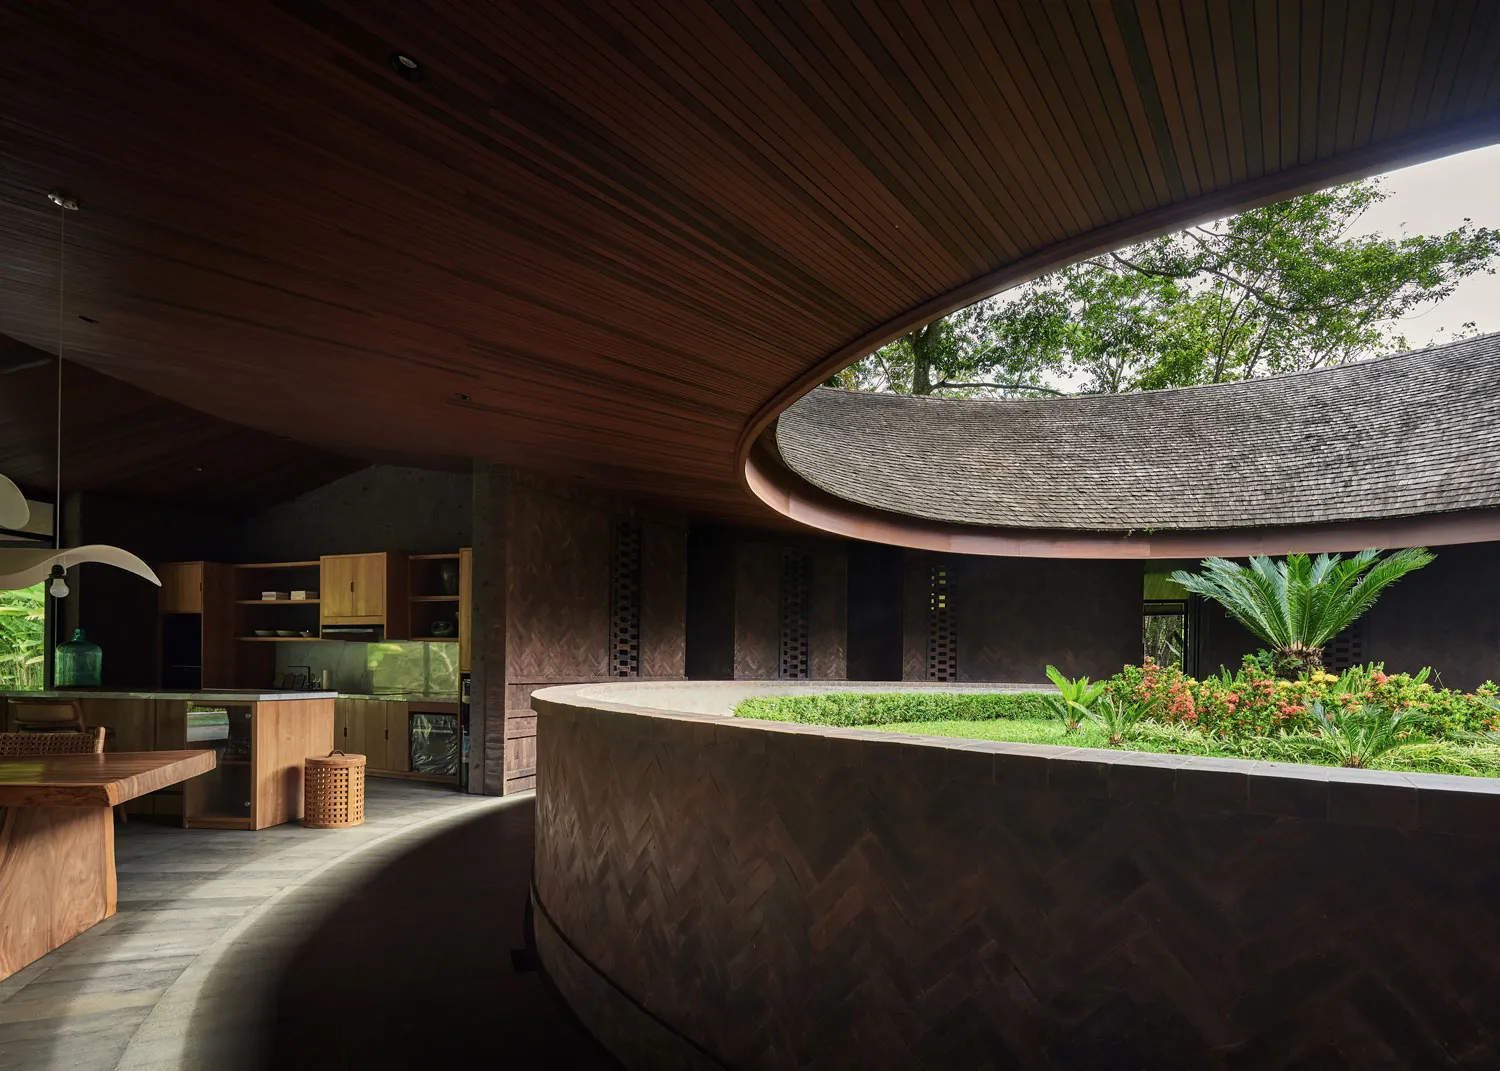
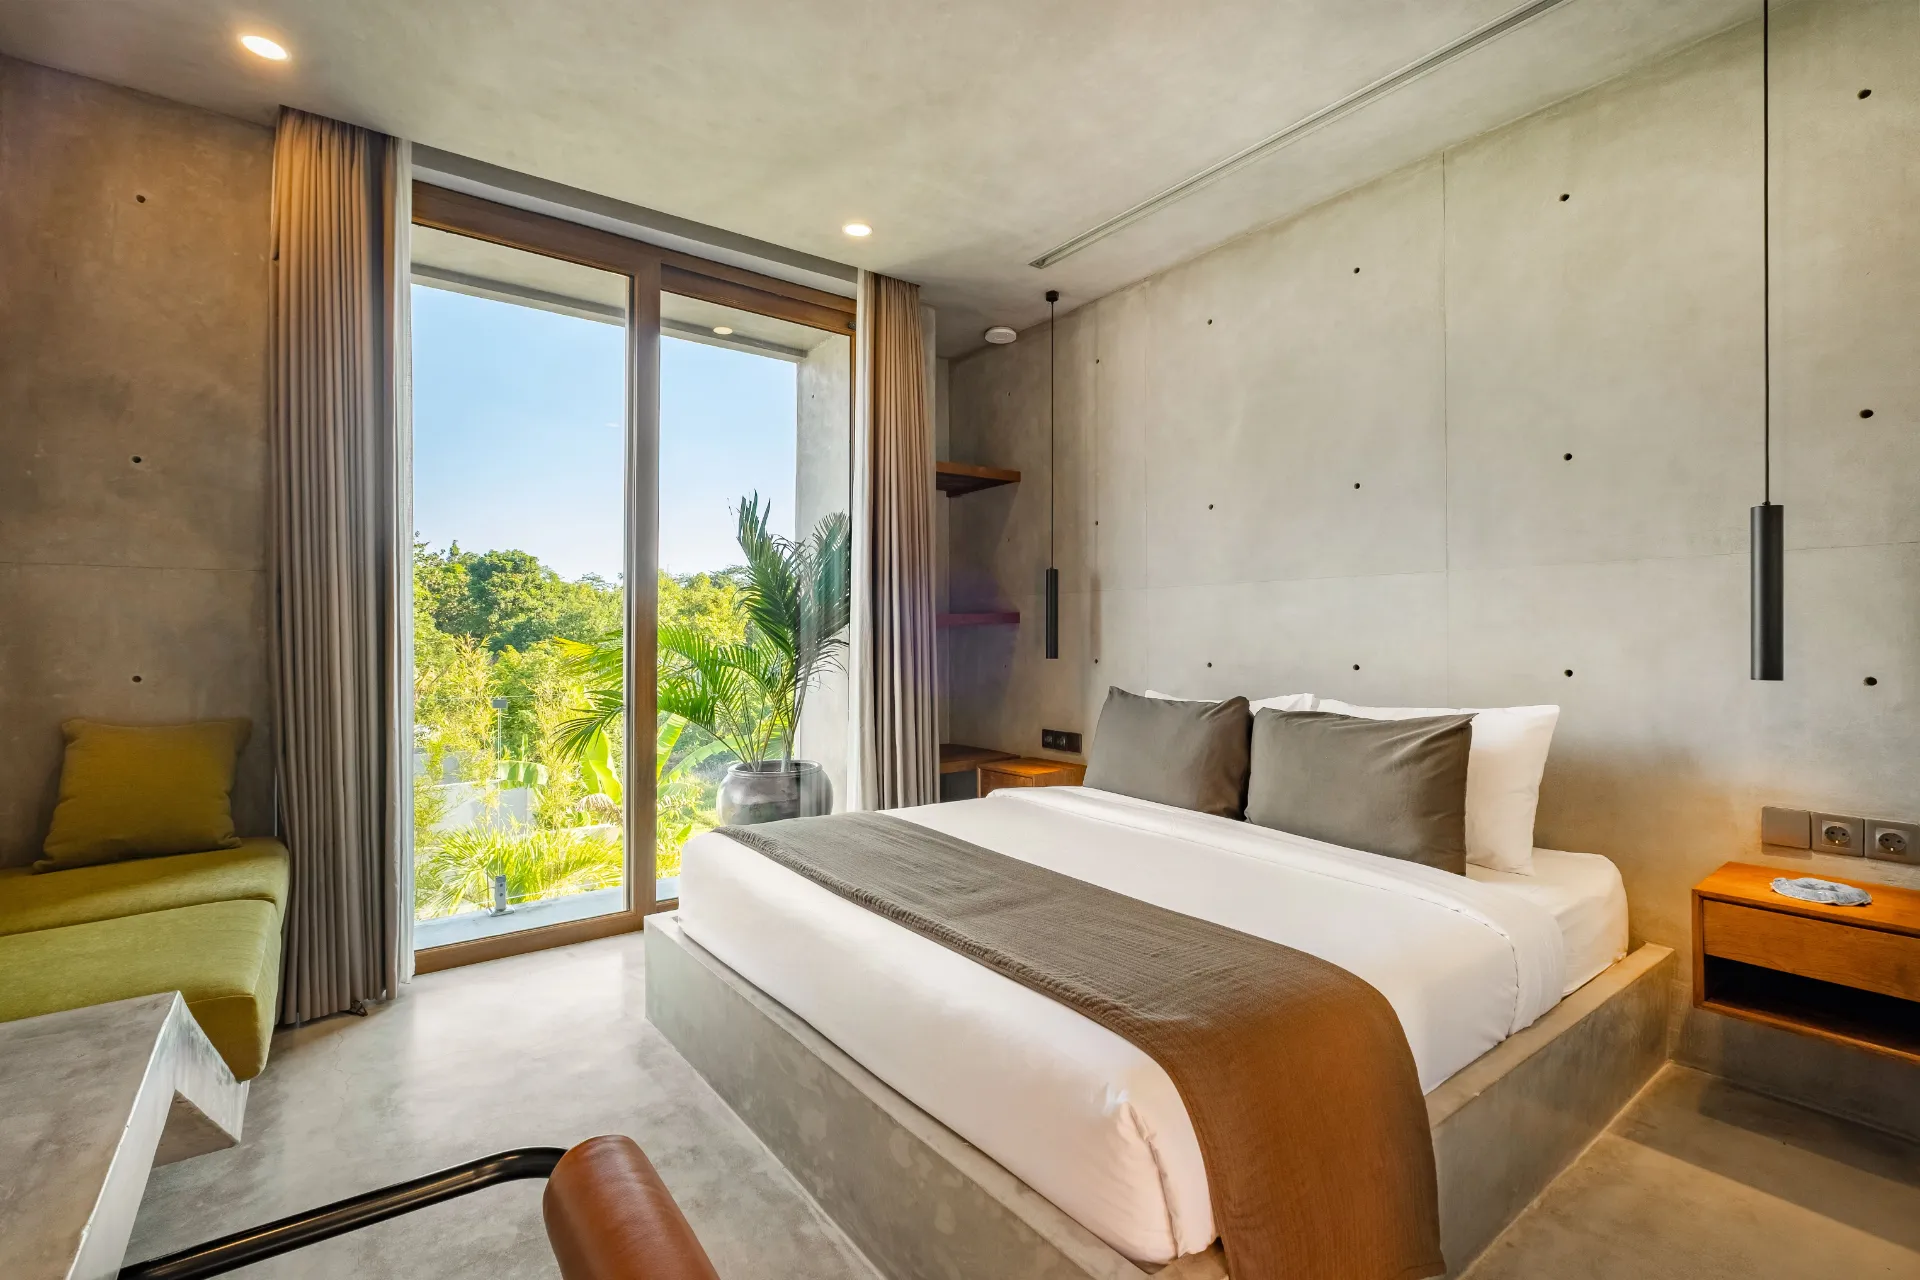
- The Property
- The Full Revenue Waterfall
- The Occupancy Picture
- Month by Month: What the Margins Actually Look Like
- What a Strong Month Looks Like
- How This Compares to the Market
- Why Bingin Specifically Outperforms the Bukit Average
- Why Direct Bookings Change Everything
- What Most Sales Decks Get Wrong
- The Bear Case: What If Rates Keep Falling
- What Could Move the Numbers Next
- Key Takeaways
- Definitions Used In This Article
- FAQ
- Sources & References
Key Numbers at a Glance
20 months, January 2025 to August 2026
| Metric | 20 months | Per year (average) |
|---|---|---|
| Gross revenue | $119,571 | $71,800 |
| Owner profit (after all costs) | $62,248 | $37,400 |
| Net yield on $280–330K acquisition | 11.3–13.3% | |
| Occupancy | 92% (562 of 608 nights) | |
| Average daily rate (ADR) | $213 | |
| RevPAR | $197 | |
| Direct bookings (share of gross) | 13% | |
| Management fee structure | 13% of gross + IDR 2.5M/month flat admin |
Who This Analysis Is For
You'll get the most out of this article if you're:
- Considering buying a 2-bed villa in Bingin or the wider Bukit Peninsula and want a real benchmark against the projection deck a broker handed you
- An existing owner of a 2-bed villa in Bali wanting to pressure-test whether your current numbers are normal, weak or strong relative to a comparable property under professional management
- A developer or investor evaluating yield on Bali villas as an asset class and wanting actuals, not pro formas, to anchor your model
If you're looking for a guide to which villa to buy, this isn't that article. This is about what one specific property actually did, month by month, line by line. The buyer's checklist sits separately.
Quick answer
- Gross revenue: about $72,000 a year on average over 20 months ($119,571 in total)
- Owner profit after every cost: about $37,400 a year, an 11.3–13.3% net yield on a $280–330K acquisition
- Occupancy: 92% of available nights across the 20 months
- 2025 was the stronger year: $74,249 gross and $40,335 profit. The 12 months to August 2026 were softer: $67,333 gross and $32,501 profit
- ADR: $213 average, from $153 in March 2026 to $296 in July 2025
- Direct bookings: 13% of gross over the 20 months, but most of that came in the first eight months
What We Projected vs What Actually Happened
The first version of this article used eight months of 2025 actuals plus four modelled months and put this villa at about $80,000 gross, 96% occupancy and a 14–16% net yield. Here is how the real numbers came in.
| Metric | 2025 projection | Actual 2025 | Actual, 12 months to Aug 2026 |
|---|---|---|---|
| Gross revenue | ~$80,000 | $74,249 | $67,333 |
| Occupancy | 96% | 92% | 89% |
| ADR | $221, trending $250+ | $222 | $207 |
| Owner profit | ~$44,000 | $40,335 | $32,501 |
| Net yield on $280–330K | 14–16% | 12.2–14.4% | 9.8–11.6% |
| Direct share of gross | 10%, projected 20–25% | 19% | 1% |
2025 landed close to the projection, a little lower on gross and profit. The last 12 months were clearly softer: occupancy fell to 70–81% from September to November 2025, and rates dropped across the Bukit in early 2026, with this villa's ADR at $158 in February and $153 in March. We are leaving the old projection in this table on purpose: the point of publishing actuals is that you can check us against them.
Who We Are and Why That Matters for This Article
Cabo Bali was founded by villa owners and developers whose background is in Google and performance marketing — not hospitality. We built and invested in our own villas before we managed anyone else's, and we started the management company because the existing options in Bali were failing the asset we'd just spent two years building.
That background shapes everything. Performance marketing trained us to measure what matters — RevPAR, channel mix, conversion rate, cost per acquisition — and to optimise against real data, not gut feel. Villa development taught us what a property actually costs to run when nothing is hidden, and what the difference is between a villa that's been built well and one that quietly leaks margin every month. One cost owners routinely under-budget is cover — see Bali villa insurance.
Combining those two skill sets is what Cabo actually is: a management company that treats your villa as a financial asset, not a hospitality project.
Every decision in this article — the pricing strategy, the channel distribution, the direct booking investment, the maintenance response — was filtered through one question: does this protect or improve the owner's yield? If it doesn't, we don't do it.
We publish data like this because investment-grade management should come with investment-grade transparency. If your current manager can't show you numbers like these, that gap is worth understanding.
The Property
- Type: 2-bedroom villa
- Location: Bingin, Bukit Peninsula
- Why Bingin: Walkable to the beach path, the warung scene, and one of the most consistent left-handers in the world. Bingin gives you Uluwatu's scenery and surf without the car-dependent isolation that defines the wider Bukit. We think of it as Uluwatu with walkability — and the booking data backs that up
- Management: Cabo Bali
- Channels: Airbnb, Booking.com, Trip.com, direct bookings via cabobali.com
- Pricing: Dynamic pricing via PriceLabs, benchmarked against AirDNA Luxury 4.9★ tier
- Acquisition cost range: $280,000–$330,000
The Full Revenue Waterfall
Here's what happened to every dollar a guest paid over the 20 months, from the gross booking amount down to what the owner kept.
Where the money went (as a percentage of gross revenue)
| Category | % of Gross | USD, 20 months |
|---|---|---|
| Gross revenue | 100% | $119,571 |
| OTA channel commissions (Airbnb, Booking.com, Trip.com) | –14.4% | –$17,269 |
| Cabo Bali fees (commission and monthly admin fee) | –15.4% | –$18,400 |
| Operating costs (housekeeping, POMEC, villa staff, other) | –18.1% | –$21,608 |
| Owner profit (before tax) | 52.1% | $62,248 |
A note on our pricing: our management fee today is 13% of gross revenue plus a flat IDR 2.5 million per month (about $150 at the report rate) for administrative work: bookkeeping, owner reporting, banking admin and vendor coordination. Across the 20 months, everything Cabo charged on this villa came to 15.4% of gross.
On a $280–330K acquisition, about $37,400 of profit a year is an 11.3–13.3% net yield before tax, depending on where in the band the villa was bought.
The Occupancy Picture
| Metric | 20 months to Aug 2026 |
|---|---|
| Nights available | 608 |
| Nights booked | 562 |
| Occupancy | 92% |
| Average daily rate | $213 |
| RevPAR | $197 |
Best months: January, April and August 2025 and April 2026 were fully booked.
Weakest months: September 2025 at 70%, November at 77% and October at 81%. Every other month was 89% or higher.
One note for accuracy: the 562 nights include five in May 2025 that earned nothing (an owner stay and a content collaboration) and one cancelled-but-paid booking in April 2026. Counting only paying guest nights, occupancy is about 91%.
Month by Month: What the Margins Actually Look Like
Rather than dollar amounts, here's the occupancy, ADR and the owner's margin (profit as a share of net revenue) for each month. Every row is an actual owner report.
Month by month, January 2025 to August 2026
| Month | Occupancy | ADR | Margin |
|---|---|---|---|
| Jan 2025 | 100% | $194 | 84% |
| Feb 2025 | 96% | $218 | 78% |
| Mar 2025 | 97% | $175 | 71% |
| Apr 2025 | 100% | $196 | 82% |
| May 2025 | 97% | $188 | 75% |
| Jun 2025 | 90% | $254 | 68% |
| Jul 2025 | 97% | $296 | 76% |
| Aug 2025 | 100% | $252 | 84% |
| Sep 2025 | 70% | $220 | 64% |
| Oct 2025 | 81% | $264 | 65% |
| Nov 2025 | 77% | $182 | 66% |
| Dec 2025 | 94% | $227 | 77% |
| Jan 2026 | 90% | $196 | 54% |
| Feb 2026 | 89% | $158 | 52% |
| Mar 2026 | 94% | $153 | 61% |
| Apr 2026 | 100% | $192 | 68% |
| May 2026 | 97% | $196 | 73% |
| Jun 2026 | 97% | $200 | 72% |
| Jul 2026 | 90% | $227 | 80% |
| Aug 2026 | 94% | $264 | 79% |
| 20 months | 92% | $213 | 73% |
What the numbers tell you
Margin follows rate, not occupancy. February and March 2026 were 89% and 94% full, but at $153–158 ADR the owner kept only 52–61% of net revenue. July and August 2025 kept 76–84% at similar occupancy because the rate was $252–296.
The cost base is steady. Monthly expenses stayed between about $690 and $1,770. The biggest lines are POMEC (electricity, water, pool and garden upkeep) and villa staff. No month's costs went above about $1,770.
The weak quarter is ours to explain. From September to November 2025 this villa ran 70–81% while the Bingin comparison set PriceLabs tracks for our 1-bedroom villas ran about 72–86%. From December it held at 89% or above for nine straight months.
Pro tip for owners. Look at the spread between your best and worst month, not just the annual average. On this villa owner margin ranged from 52% to 84%. A manager who only shows you the average is hiding the months that matter for your cash flow.
What a Strong Month Looks Like
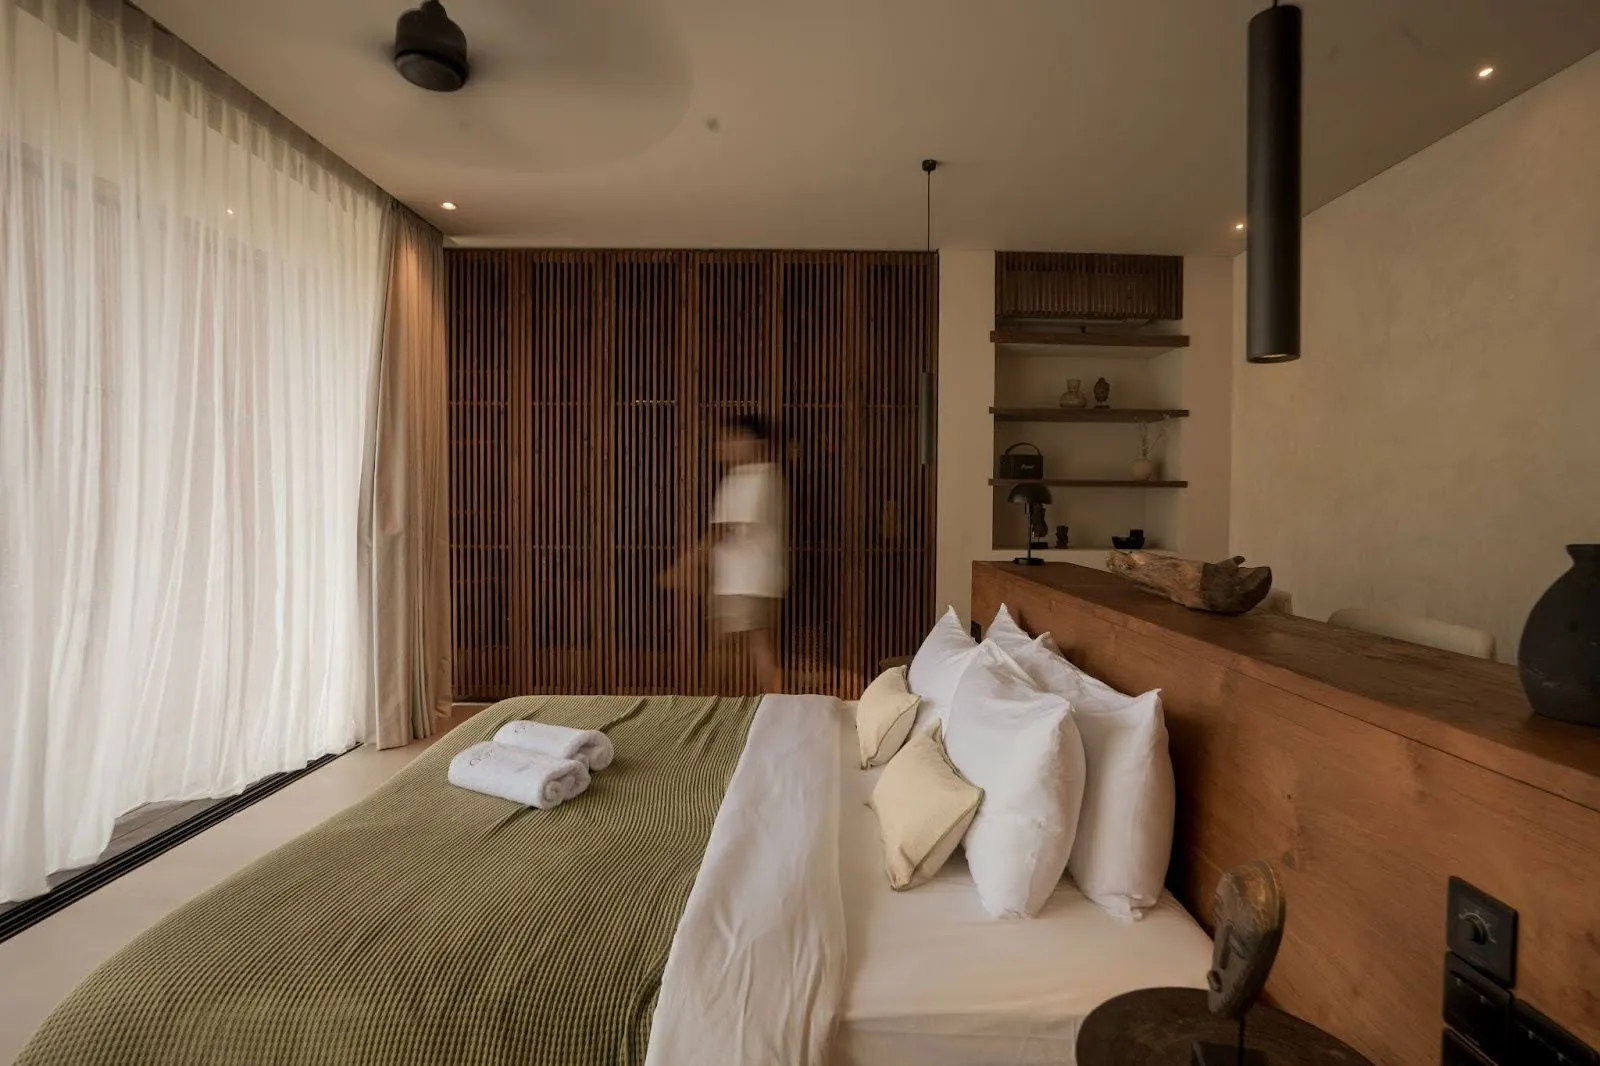
July 2025 was the biggest month of the 20. The villa was 97% booked at a $296 ADR and grossed $8,877, and the owner kept 76% of net revenue. August 2025 was fully booked at $252 and kept 84%, the joint-best margin with January 2025.
The pattern behind months like that is longer stays at peak rates. Fewer turnovers mean fewer cleans, less laundry and fewer empty nights between guests, so more of each dollar reaches the owner.
How This Compares to the Market
AirDNA benchmarks the South Kuta and Bukit Peninsula market (April 2026) at:
- RevPAR: about $55 a night
- Occupancy: 70%
- ADR: about $90 a night
Over 20 months this villa ran at:
- RevPAR: $197 (about 3.6× the market benchmark)
- Occupancy: 92%
- ADR: $213
The outperformance is real, but it is conditional. This villa is well built, well located in the highest-demand pocket of the Bukit, professionally photographed, and actively managed with dynamic pricing and multi-channel distribution. The Bingin premium only converts to revenue with the right setup behind it.
A 2-bed villa in Bingin with average photos, static pricing, one channel and reactive maintenance would not produce these numbers. The location is necessary but not sufficient.
Why Bingin Specifically Outperforms the Bukit Average
Worth zooming in on this. The wider Bukit Peninsula is a large submarket — it includes Pecatu, parts of Jimbaran, Balangan, Padang Padang, and Uluwatu proper, in addition to Bingin. Within that submarket, the per-village performance varies significantly.
Bingin's specific advantage is walkability. Most of the Bukit is car-dependent — you can't walk to a coffee, you can't walk to dinner, and you can't walk to the beach without driving to a clifftop first. Bingin breaks that pattern. The beach path is a 4-minute walk from most of the village. The warung scene is integrated, not gated. The surf is at the bottom of the cliff steps. For the segment of the international guest who wants the Bukit's scenery without renting a scooter, Bingin is the only viable answer.
That walkability translates to higher booking conversion at higher ADRs. Guests who would normally choose Canggu for the walkable-village reason find their way to Bingin once they discover the format exists in the south. We see this in the booking data — Bingin guests skew slightly older, stay slightly longer, and convert from the listing page at higher rates than equivalent Uluwatu-proper guests.
That is the structural reason this 2-bed in Bingin has averaged about $72K a year in gross bookings, even through a softer 2026.
Why Direct Bookings Change Everything
Most villa management companies in Bali are entirely dependent on OTAs. Every booking comes through Airbnb or Booking.com, every dollar of revenue is subject to their commission, their policies, and their leverage.
That's a problem — and not just because of the 15–17% commission.
OTAs have leverage over your villa. When a guest complains on Airbnb, the platform can issue refunds from your payout without your approval. When Airbnb changes its review algorithm, your ranking can shift overnight. When Booking.com raises its commission rates, you have no negotiating position. The platform owns the relationship with the guest, not you.
Every booking that comes through your own direct channel removes that leverage entirely. The guest pays you directly. The review lives on your terms. The refund decision is yours, not the platform's. And the 15–17% commission stays in the owner's pocket.
This is why we push direct bookings hard. It's not just a margin play — it's a risk-reduction strategy. The more of your revenue that flows through your own channel, the less exposed you are to platform decisions that you didn't make and can't influence.
On this villa, direct bookings through cabobali.com made up 13% of gross over the 20 months. The split matters: in the first eight months of 2025 direct was 27% of gross, including one 30-night stay booked through our site. In the 12 months to August 2026 it fell to about 1%, with almost every night coming through Airbnb. Direct is still the highest-margin channel we have, and rebuilding it on this villa is on our list.
Pro tip for owners. Ask your management company for the direct booking share on your own villa, in writing, as a percentage of gross, and ask how it has moved year on year. A portfolio-wide number tells you nothing about your villa.
What Most Sales Decks Get Wrong
A broker deck for this villa would typically project 80% occupancy at $200 ADR with expenses "around 20%". That gives $58,400 gross and, if commissions are forgotten, a profit near $46,700: a "15% yield" on a $310K purchase.
The real 20 months were different on every line. Gross was higher than that deck, about $72K a year, because occupancy beat 80%. But OTA commissions and Cabo's fees took about 30% of gross before a single running cost, and running costs took another 18%. The owner kept 52% of gross, about $37K a year, which is a 12% yield on $310K. A strong result for an unleveraged property, but lower than the deck, and it swung from 13% in 2025 to about 10.5% in the last 12 months.
That gap is why we publish actuals, including the stretch where our own earlier projection was too high.
Pro tip for buyers. Ask your broker for at least 12 months of actual owner reports from a comparable villa: occupancy, ADR, commissions, expenses and profit, including the bad months. Not a projection. If they cannot produce it, that is the signal.
The Bear Case: What If Rates Keep Falling
The Bukit has seen a significant supply build over the past three years, and 2026 already showed softer rates: this villa's ADR in February and March 2026 was roughly half its July 2025 peak. If rates fell further across a full year, here's what that would do, holding occupancy at 92% and the cost base where it was:
What if rates drop?
Per year, from the 20-month average, holding occupancy and running costs flat
| ADR change | Annual gross | Owner profit | Yield on $280K | Yield on $305K | Yield on $330K |
|---|---|---|---|---|---|
| No change | $71,800 | $37,400 | 13.3% | 12.3% | 11.3% |
| –10% | $64,600 | $32,200 | 11.5% | 10.6% | 9.8% |
| –15% | $61,000 | $29,700 | 10.6% | 9.7% | 9.0% |
| –20% | $57,400 | $27,100 | 9.7% | 8.9% | 8.2% |
The honest takeaway: a 20% fall in rates takes this villa to about an 8–10% net yield. Running costs do not fall when rates do, so profit drops faster than revenue. The last 12 months already sat close to the –10% row.
What protects a villa in a softer market is what it is priced on. Villas priced on equivalence, identical floorplans competing on dollar-per-night, lose first. Villas with a design, location and review signal guests choose on hold rate better. How that is managed day to day is covered in our Bali villa pricing strategy guide.
Pro tip for buyers. Underwrite at a 15–20% rate compression and check the yield there. If the deal still works, you have a margin of safety.
What Could Move the Numbers Next
- The shoulder months: September to November 2025 averaged 76% occupancy. Lifting those months back to the 90%+ the villa ran in the rest of the period would add roughly $3,000–4,000 of gross a year at the same rates
- Rate recovery: the villa reached $264 ADR in August 2026 and $296 in July 2025. Holding rates closer to that through the shoulder season matters more to owner profit than filling more nights, because costs stay flat
- Direct share: it was 27% of gross in early 2025 and about 1% in the last 12 months. Every booking moved from Airbnb to direct saves the owner roughly 15–17% of that booking
We are not putting a forward yield number on this. The last forward number we published was too high, and the next version of this article will add another 12 months of actuals.
Key Takeaways
- Over 20 months, January 2025 to August 2026, this 2-bed in Bingin ran 92% occupancy, about 22 points above AirDNA's ~70% Bukit Peninsula benchmark.
- It grossed $119,571 and the owner kept $62,248 after every cost: about $37,400 a year, an 11.3–13.3% net yield on a $280–330K acquisition.
- 2025 was stronger ($74K gross, $40K profit) than the 12 months to August 2026 ($67K gross, $33K profit).
- ADR averaged $213; RevPAR of $197 was about 3.6× the AirDNA Bukit benchmark.
- Owner margin ranged from 52% to 84% by month and followed rate more than occupancy.
- Direct bookings were 13% of gross overall, but fell from 27% in early 2025 to about 1% in the last 12 months.
Definitions Used In This Article
- ADR (Average Daily Rate): Total gross revenue divided by the number of nights occupied. The headline rate per booked night.
- RevPAR (Revenue Per Available Room/Night): Total gross revenue divided by the number of available nights (including unoccupied ones). The truer measure of property performance because it combines rate and occupancy into one number.
- Occupancy: Nights booked divided by nights in the month, as shown in the owner report.
- OTA (Online Travel Agency): Booking platforms like Airbnb, Booking.com, and Trip.com that bring guests to the villa in exchange for a commission, typically 13–17% of gross.
- Net Revenue: Gross revenue minus OTA commission and management fee. This is what flows into the villa's operating account.
- POMEC (Property Operations, Maintenance and Energy Costs): The line item that covers electricity, water, pool chemicals, garden upkeep, and routine maintenance. On this villa it was about 8% of gross over the 20 months.
- Net Yield: Annual owner profit (after every cost — commissions, management, operations) divided by the villa's acquisition cost. The cleanest single number for comparing a villa investment to other asset classes.
- Channel Commission: The fee the OTA charges per booking. Airbnb is roughly 16–17%, Booking.com is roughly 13–15%, Trip.com varies by booking.
FAQ
What does a 2-bed villa in Bingin actually earn?
This one grossed $119,571 over 20 months, January 2025 to August 2026, which is about $72,000 a year, at 92% occupancy and a $213 average nightly rate. After OTA commission, Cabo's fees and all running costs, the owner kept $62,248, about $37,400 a year.
What net yield does a 2-bed in Bingin make?
On this villa, about 11.3% to 13.3% a year before tax over 20 months, depending on whether it was bought at $330K or $280K. It was 12.2 to 14.4% in 2025 and 9.8 to 11.6% in the 12 months to August 2026.
Why is this lower than the first version of this article?
The first version used eight months of actuals and four modelled months, and projected about $80K gross, 96% occupancy and 14 to 16% yield. Calendar 2025 came in at $74K and 92%. The following months were softer, with weaker occupancy from September to November 2025 and lower rates in early 2026.
What if the Bali villa market gets oversupplied and rates drop?
Holding occupancy at 92% and costs flat, a 10% fall in rates takes this villa to about 10 to 11.5% net yield, and a 20% fall to about 8 to 10%. Costs do not fall with rates, so profit drops faster than revenue.
What's the management fee structure?
13% of gross revenue plus a flat IDR 2.5 million per month for administrative work. Across the 20 months, everything Cabo charged on this villa came to 15.4% of gross.
Did the villa have any owner stays?
One: three nights in May 2025, plus two nights used for a content collaboration. Every other night was available to guests.
What channels generate the bookings?
Mostly Airbnb, then Booking.com, with direct bookings through cabobali.com at 13% of gross over the 20 months. Direct was strong in early 2025 and fell to about 1% in the last 12 months.
Is this villa's performance typical of Cabo's portfolio?
On occupancy, yes. Across the five Bingin villas with a full 12 months of owner reports to August 2026, occupancy was 91%. This villa ran 92% over its 20 months and 89% over the last 12.
If You Own a Villa in Bingin
If your 2-bed isn't hitting these numbers, the question is what's holding it back: pricing, photography, channel mix, operational discipline or maintenance. Usually it's some combination.
We're happy to look at your current performance and give you an honest read on where the gap is. No pitch. No pressure. Just the data.
About the author. Rissa Prima is Digital Marketing Manager at Cabo Bali, which manages boutique villas across Uluwatu, Bingin and Canggu. Rissa writes from the operator's side of Bali villas — real numbers, real guest feedback, and lessons from the team running the portfolio day to day.
Related reading:
- What a 1-Bed Villa in Uluwatu Actually Earns (2026)
- How Much Does Bali Villa Management Cost? A Full 2026 Breakdown
- The Top 10% of Villas in Uluwatu: What Cabo Bali Is Doing Differently
- How to Choose a Villa Management Company in Bali
Sources & References
Performance figures come from Cabo Bali’s own monthly owner reports: every month from January 2025 to August 2026 is an actual. Nothing in this version is modelled. All figures are presented in approximate USD for international readability. Market baselines and the metric definitions used here are drawn from the authoritative industry, government and platform sources below; AirDNA South Kuta/Bukit Peninsula data is current as of April 2026. As a reference point, AirDNA’s island-wide data puts average Bali short-term-rental occupancy in the mid-40% range and the Bukit submarket near 70% — the benchmarks this villa’s 92% is measured against.
- AirDNA — short-term-rental market data (RevPAR, occupancy and ADR baselines for Bali and the Bukit Peninsula).
- BPS Bali (Badan Pusat Statistik Provinsi Bali) — official Bali foreign-tourist arrival statistics.
- Bank Indonesia — official IDR reference exchange rates used for USD conversion.
- Horwath HTL — Indonesia hotel and tourism market reports.
- Colliers Indonesia — Bali and Indonesia property market research.
- STR (CoStar) — global hospitality benchmarking and the standard definitions of ADR, occupancy and RevPAR.
- Airbnb Help Center — host service-fee structure.
- Booking.com Partner Hub — commission model.
- PriceLabs — dynamic-pricing methodology referenced for rate setting.
- Wheelhouse — short-term-rental revenue-management benchmarks.
- Bali Hotels Association — island-wide occupancy and tourism commentary.