.jpeg)
By Keanu Fischell, Co-Founder, Cabo Bali · Updated 25 June 2026 · 8 min read
Real numbers from a real villa. 12 months of actual performance from a one-bedroom villa we manage in Uluwatu — occupancy, margins, expense ratios, and what the owner actually keeps. No projections. No pro formas. The spreadsheet, with the ugly months included.
All figures in this article are presented in USD for international readability. Cabo Bali complies with Indonesian currency regulations — all villa rental transactions are priced and settled in Indonesian Rupiah (IDR) as required by Bank Indonesia. USD equivalents shown here are approximate and for reference only.
Quick answer
- Annual gross revenue: Low-to-mid $50Ks
- Owner profit after everything: 14% net yield on a $200–250K acquisition
- Owner keeps: 57–60% of gross in a normalised year. 2025 came in at 51% due to a month of owner use and a couple of elevated expense months — still a 14% net yield
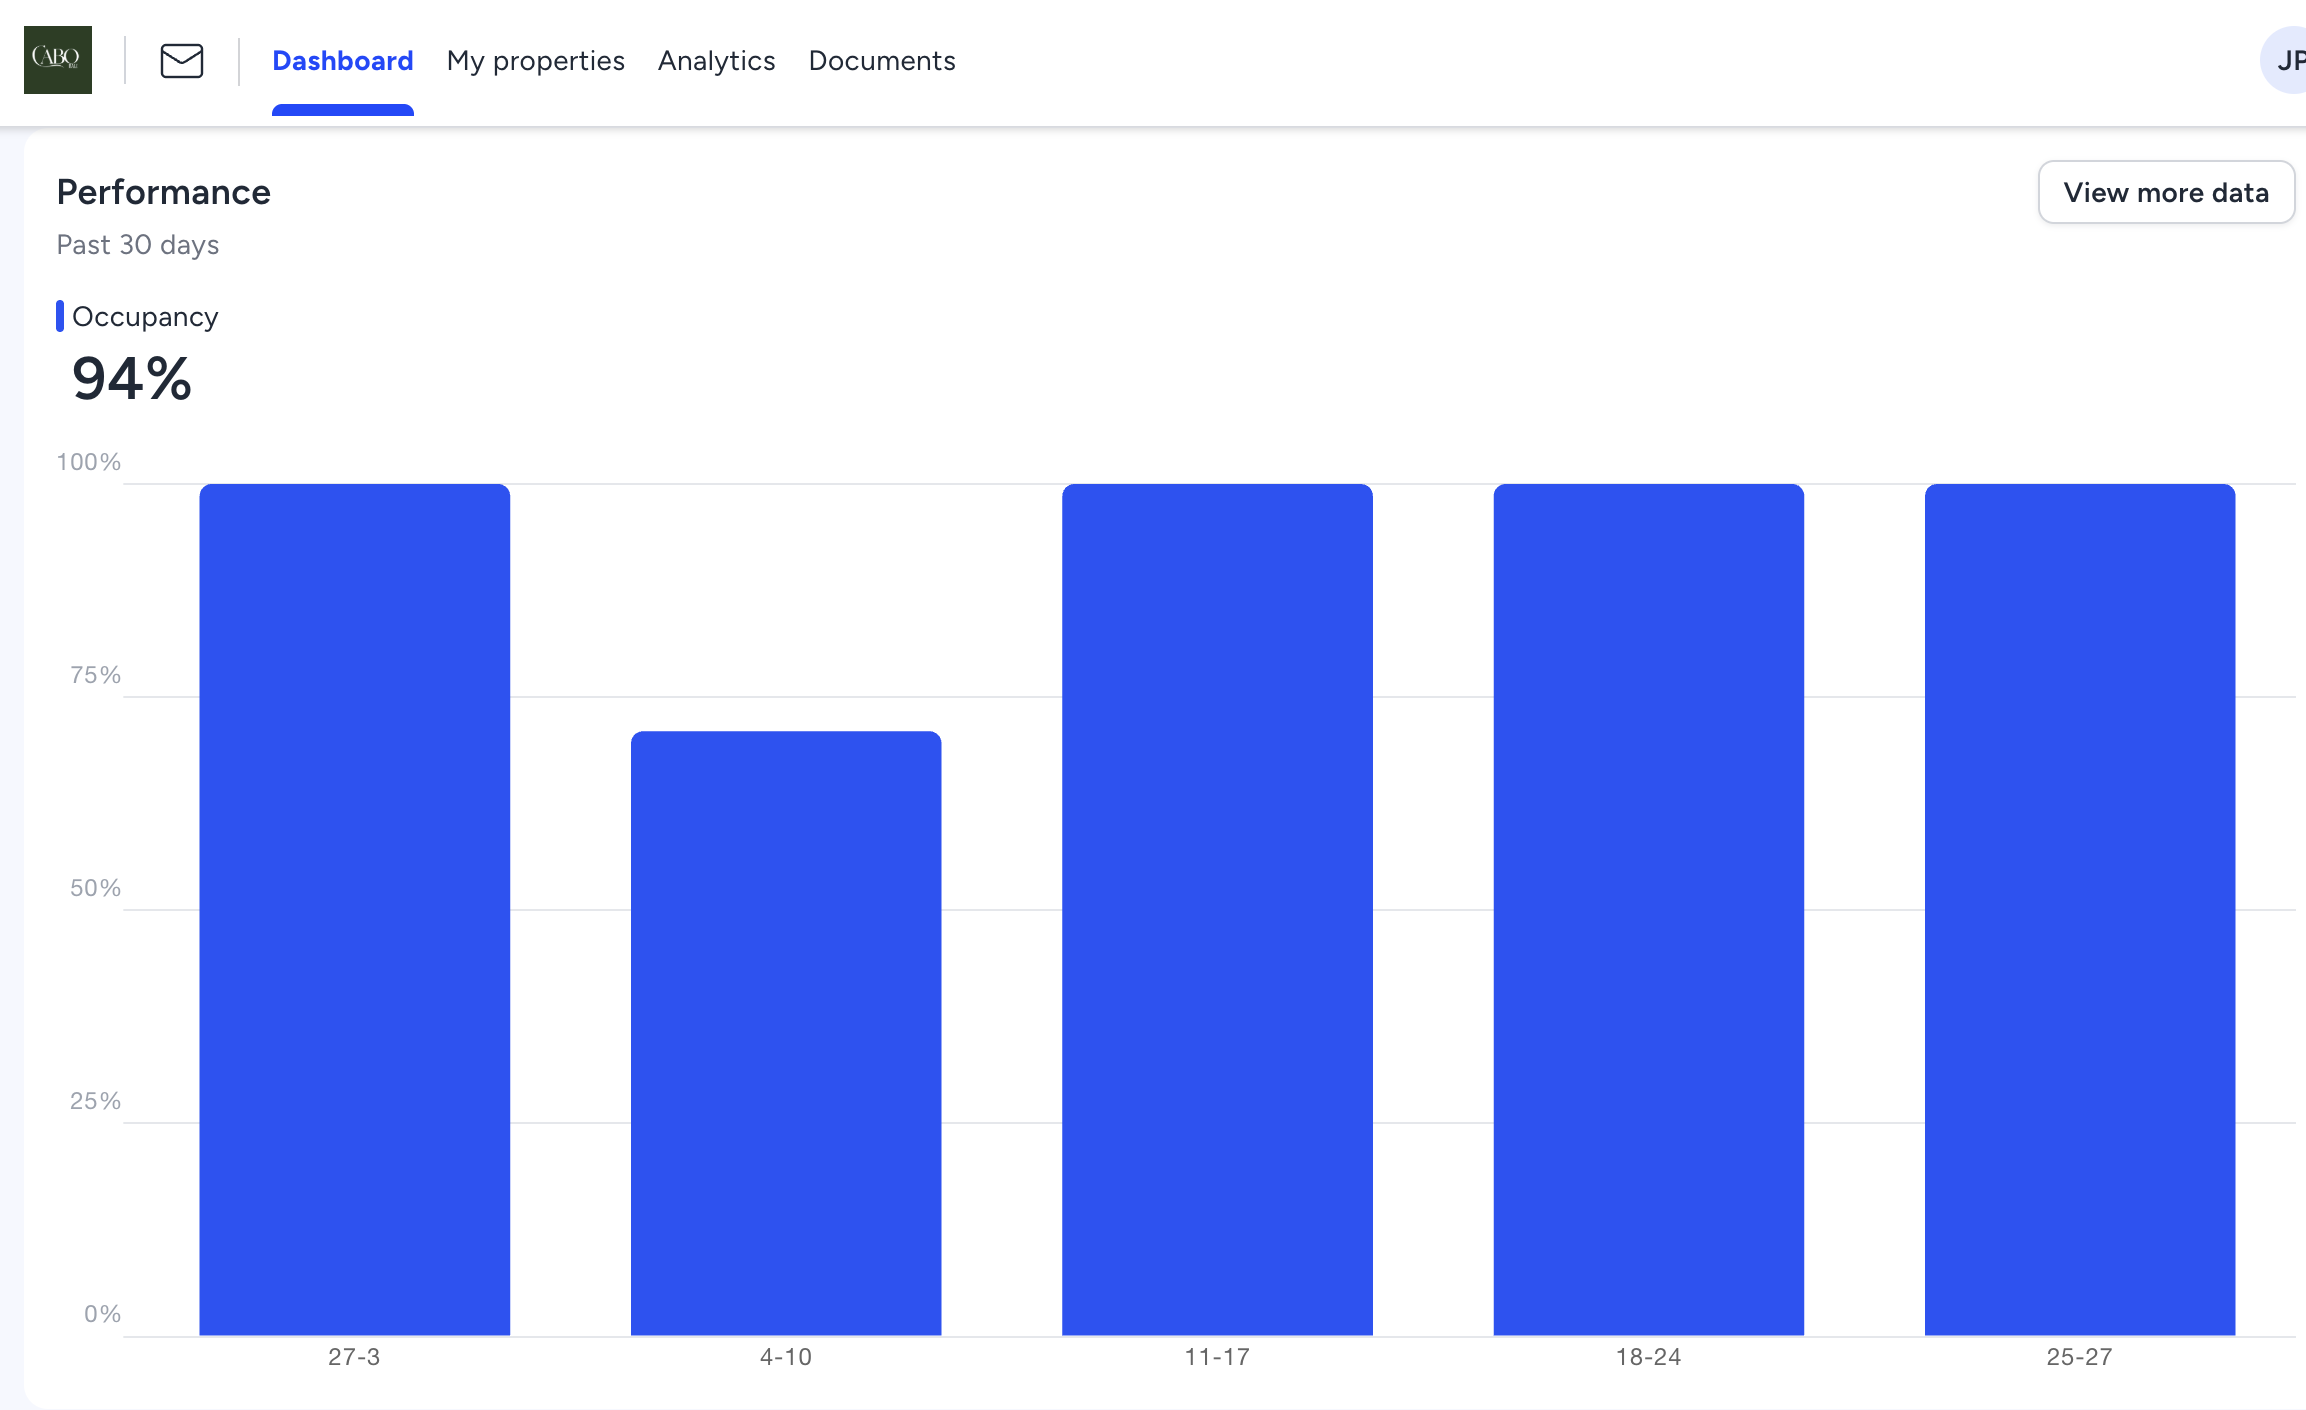
- Occupancy: 96% on available nights (owner stay excluded — those nights were never on the market). Recent months trending at 97%
- ADR: Trending from $147 average in 2025 toward $170+ in recent months
- Direct bookings increase owner margin by cutting OTA commissions — building this channel is a core part of our strategy
Why We’re Publishing This
Every sales deck in Bali shows you a revenue projection. Projected occupancy, projected ADR, projected annual return — all forward-looking, all optimistic, all conveniently free of the months where things go wrong.
This article is the opposite. It’s a backward-looking, 12-month performance summary from a single one-bedroom villa we manage in Uluwatu. Every number comes from the actual owner report. The good months are here. So are the bad ones.
We’re publishing it because we think the gap between what buyers are told to expect and what owners actually experience is one of the biggest problems in the Bali villa market. And the fix isn’t better projections — it’s real data from real properties, published openly.
If you’re considering buying a villa in Uluwatu, or if you already own one and want to benchmark your performance, this is the most honest reference point we can give you.
Who We Are and Why That Matters for This Article
Cabo Bali was founded by villa owners and developers whose background is in Google and performance marketing — not hospitality. We built and invested in our own villas before we managed anyone else’s, and we started this company because we couldn’t find a management partner who thought about our properties the way we did: as investments with a return target, not just as listings that needed cleaning between guests.
That background shapes everything. Performance marketing trained us to measure what matters — RevPAR, channel mix, conversion rate, cost per acquisition — and to optimise against real data, not gut feel. Villa development taught us what drives yield from the build stage forward.
Combining those two skill sets is what Cabo actually is: a management company that treats your villa as a financial asset, not a hospitality project.
Every decision in this article — the pricing strategy, the channel distribution, the direct booking investment, the maintenance response — was filtered through one question: does this protect or improve the owner’s yield? That’s not a tagline. It’s the operating model.
We publish data like this because investment-grade management should come with investment-grade transparency. If your current manager can’t show you numbers like these, that gap is worth understanding.
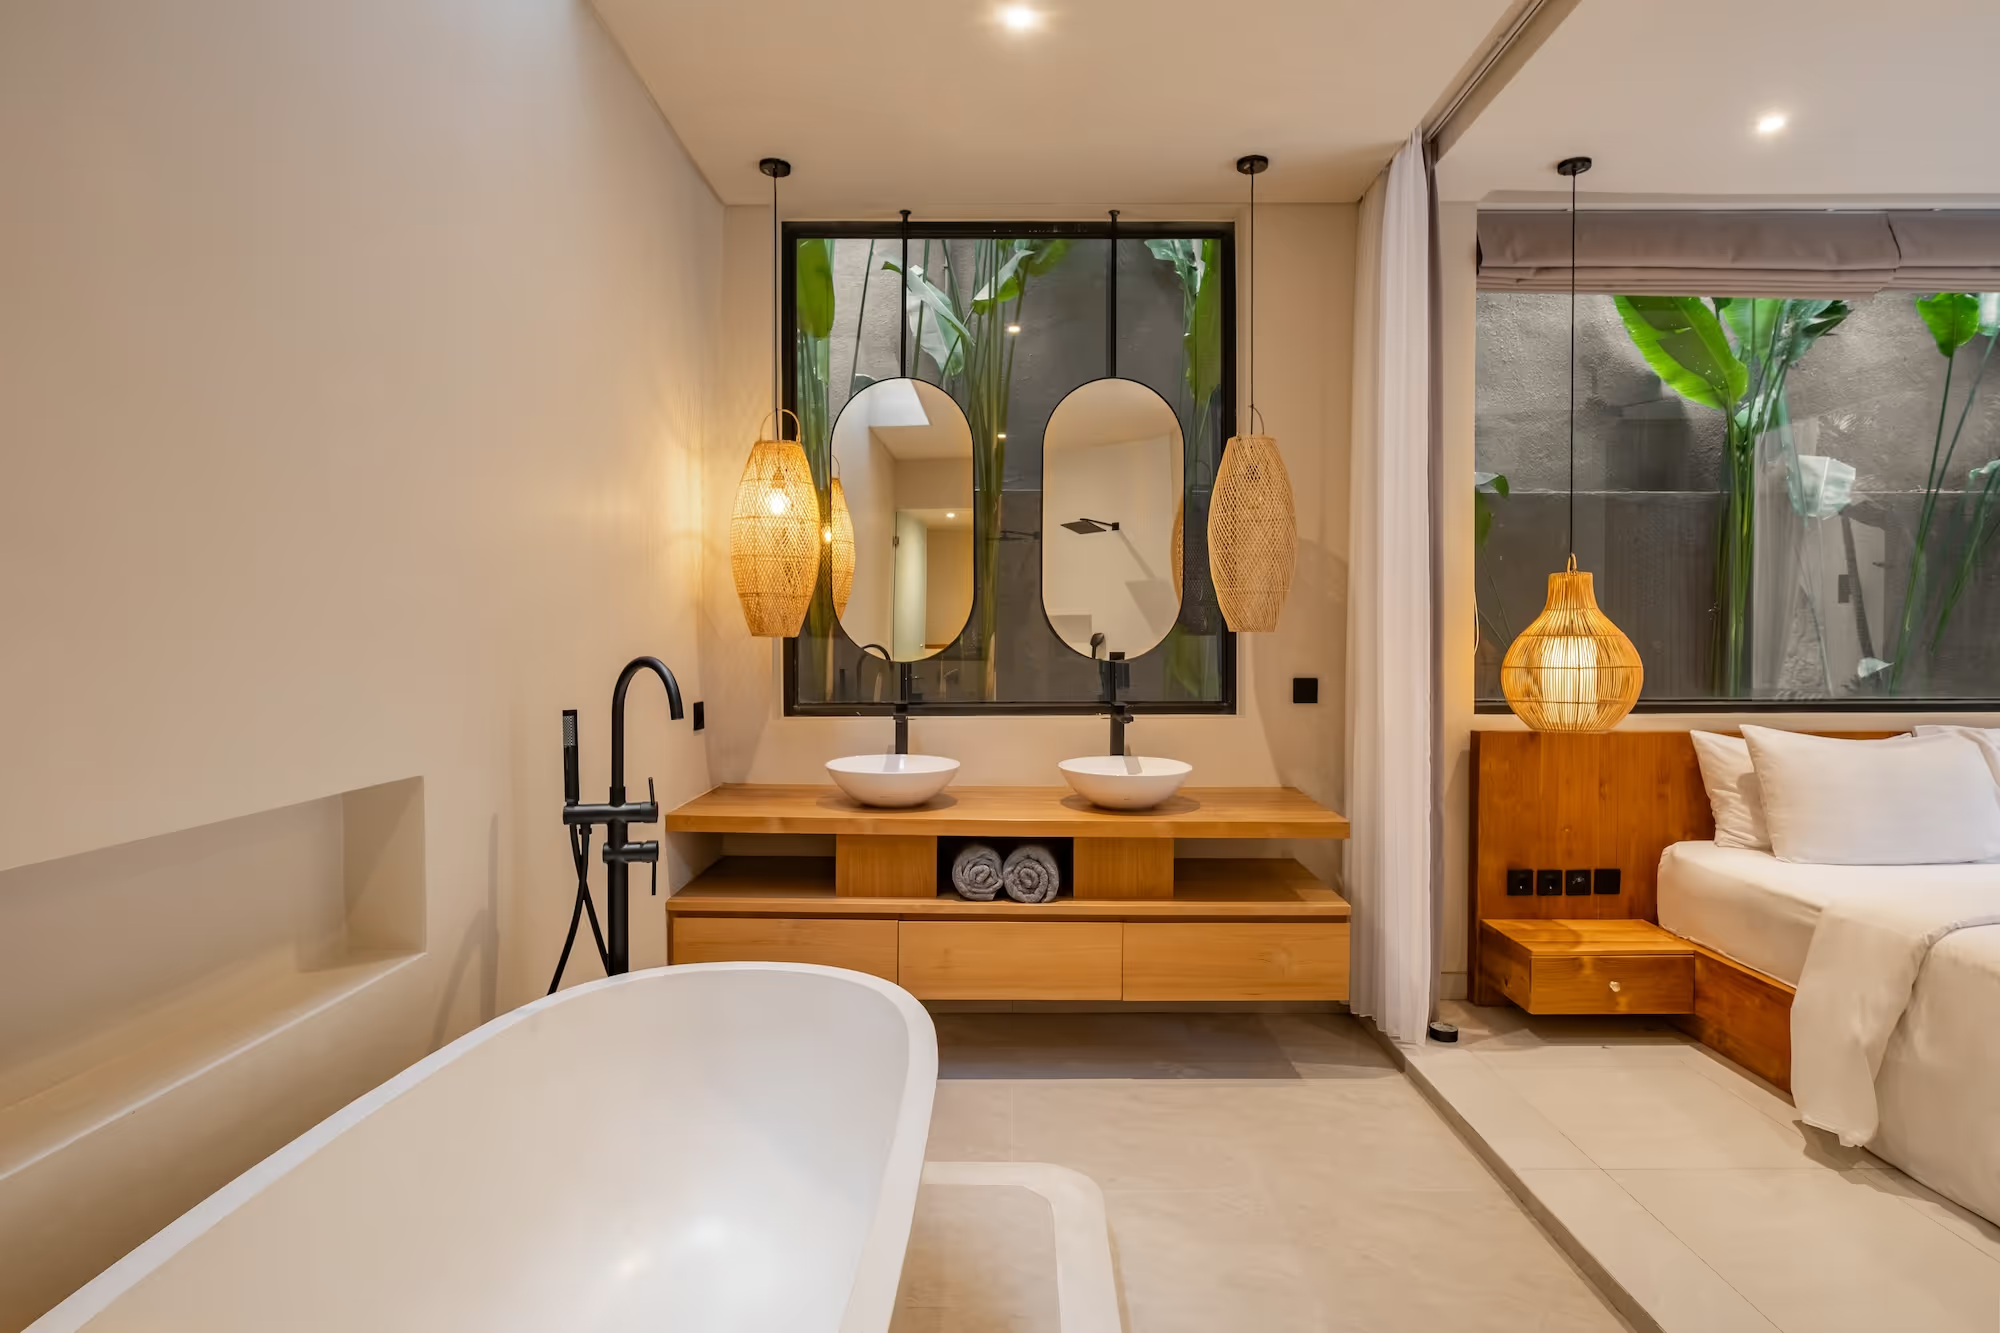
The Property
.jpg)
- Type: 1-bedroom villa
- Location: Uluwatu, Bukit Peninsula
- Management: Cabo Bali
- Channels: Airbnb, Booking.com, Trip.com, direct bookings via cabobali.com
- Pricing: Dynamic pricing via PriceLabs, benchmarked against AirDNA Luxury 4.9★ tier
- Acquisition cost range: $200,000–$250,000
The Full Revenue Waterfall
Here’s what happens to every dollar a guest pays — from the gross booking amount down to what the owner actually receives.
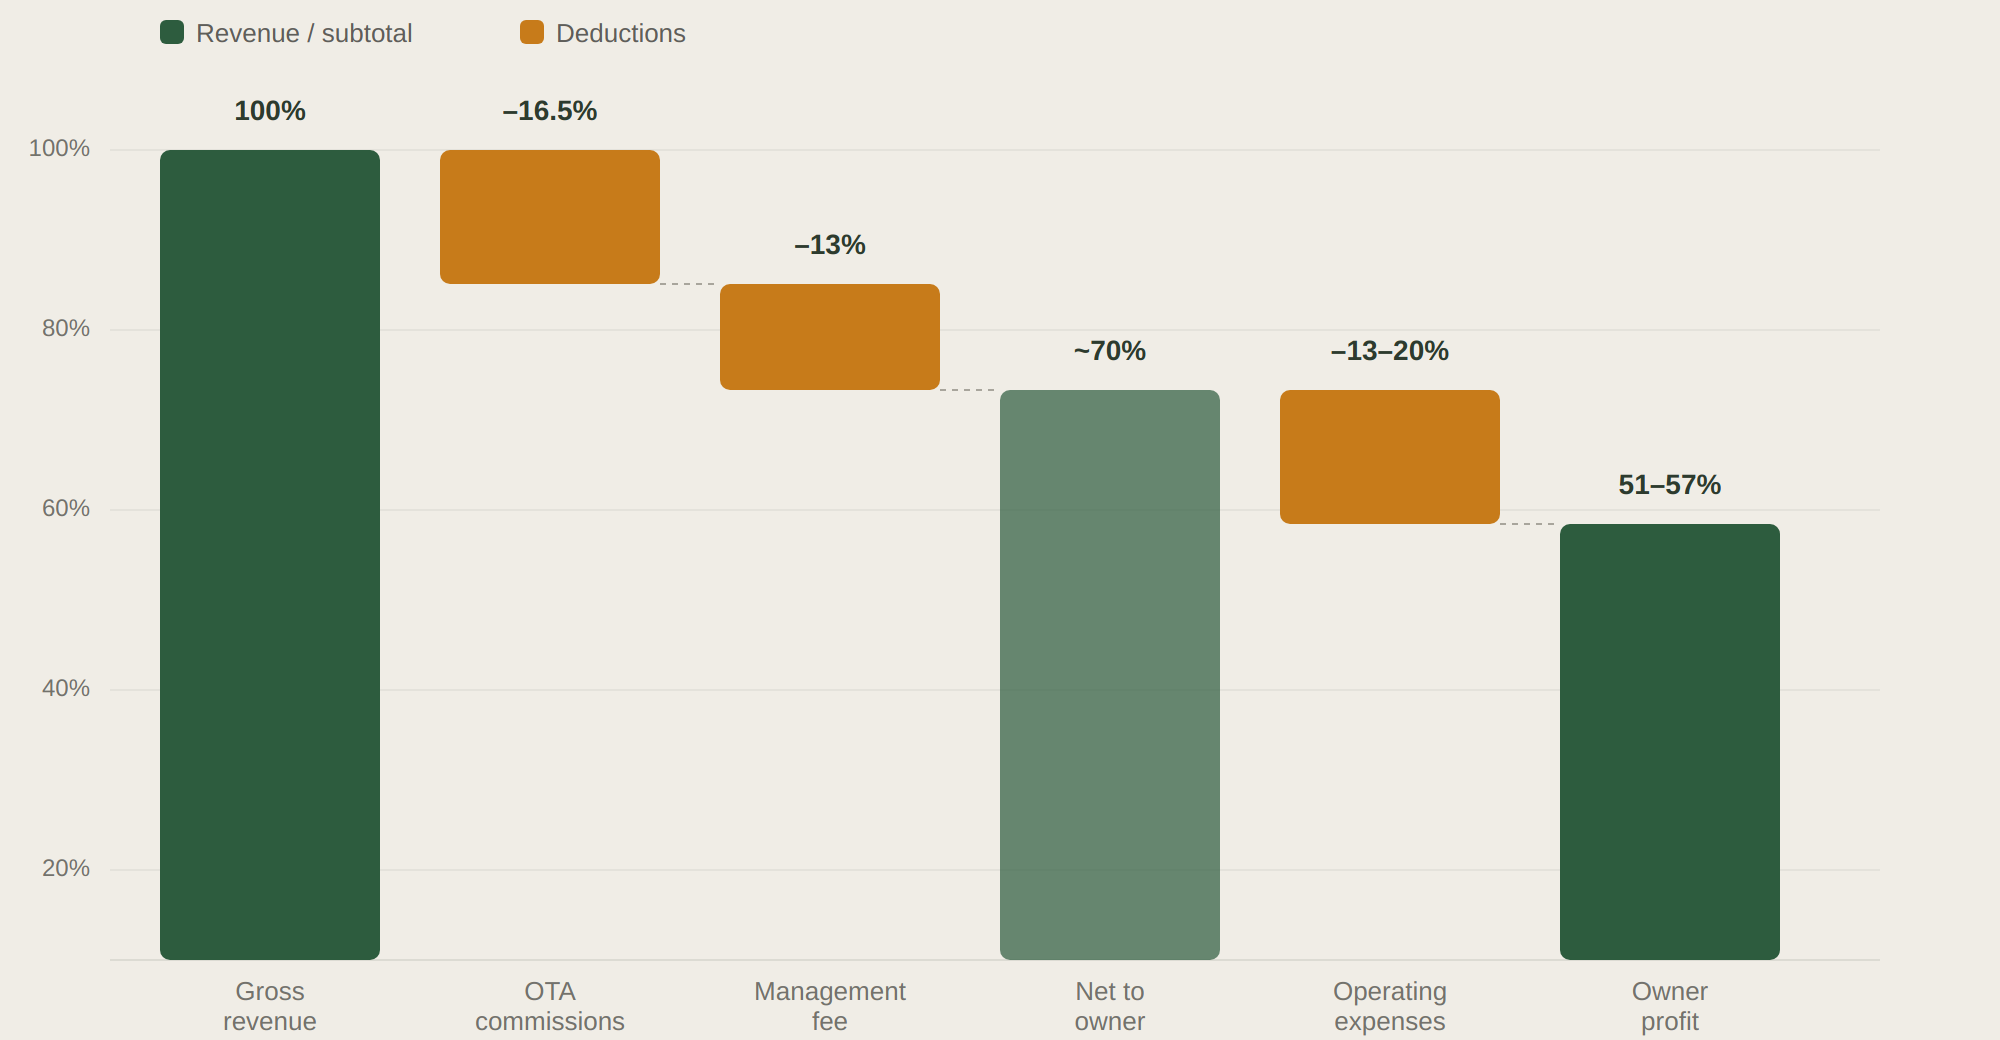
Where the money goes (as a percentage of gross revenue)
| Category | % of Gross |
|---|---|
| Gross Revenue | 100% |
| OTA Channel Commissions (Airbnb/Booking.com/Trip.com blend) | –16–17% |
| Management Fee | –13% |
| Net Revenue to Owner | ~70% |
| Operating Expenses (housekeeping, pool, garden, POMEC, staff, maintenance) | –13–20% |
| Owner Profit (before tax) | 51–57% |
The 51% is the actual 2025 result, which included a month of owner use and a couple of months with elevated expenses. The 57% is the normalised return — and the realistic forward expectation.
On a $200–250K acquisition, that translates to 14% net yield annually.
The percentage of direct bookings we drive also directly increases owner margin. Every booking that comes through cabobali.com instead of Airbnb saves the owner 15–17% in OTA commissions on that booking — money that flows straight to the bottom line.
The Occupancy Picture
| Metric | 2025 Performance | Recent Trend |
|---|---|---|
| Nights available (excl. owner stay) | 335 | — |
| Nights occupied | 321 | — |
| Occupancy | 96% | 97% |
| Average daily rate | ~$147 | Trending $170+ |
| RevPAR | ~$144 | Trending $160+ |
Peak months (June, August): 100% occupancy — every available night booked.
Lowest occupancy month: May at 90% — still well above the AirDNA Bukit Peninsula average of 70%.
The ADR trend is meaningful. In January 2025 the villa averaged $193/night. By May it had softened to $139 during shoulder season. Recent months have recovered above $170 as the listing matured and rate positioning strengthened. The 2025 annual average of $147 understates where this villa is currently pricing.
Month by Month: What the Margins Actually Look Like

Rather than dollar amounts, here’s what the owner’s margin looked like as a percentage of net revenue each month:
| Month | Occupancy | Margin (% of net revenue) | Notes |
|---|---|---|---|
| January | 97% | 81% | Peak season, strong rates |
| February | 96% | 79% | |
| March | 94% | 74% | |
| April | — | Owner stay (not available for booking) | |
| May | 90% | 72% | Shoulder season, rate softens |
| June | 100% | 52% | Elevated expenses (pump + service renewals) |
| July | 97% | 73% | Neighbouring construction |
| August | 100% | 84% | Best margin month of the year |
| September | 93% | 63% | Seasonal + some carryover costs |
| October | 94% | 82% | |
| November | 97% | 75% | |
| December | 97% | 72% | |
| Full Year | 96%* | 72.3%* | |
What the numbers tell you
The good months are predictable. January, August, and October all cleared 80%+ margin. These are peak-season months where occupancy is high, rates hold, and nothing unusual hits the expense line.
A few months saw elevated expenses. June had a pump replacement land in the same window as annual service renewals — costs clustered rather than spread. July had some disruption from neighbouring construction. These are normal ownership realities, not performance problems. The annual picture absorbed them comfortably, and the villa still returned 14% net for the year.
When costs spike in a given month, the management response matters. We issued strategic partial refunds where guest experience was affected — not as damage control, but because protecting a 5-star review protects the villa’s ADR for every booking that follows. That’s investment-minded management in practice.
Pro tip for owners. Don’t judge your villa’s performance by its worst month. Judge it by the annual picture. Costs cluster — that’s normal. A pump replacement, a wifi renewal, and a guest refund can all land in June and make it look terrible. But if the annual margin holds above 50% of gross, the villa is performing. Ask your manager for the 12-month view, not the monthly snapshot.
What a Normal Month Looks Like at the Booking Level
To give a sense of the booking rhythm, here’s one example month. In this particular month, the villa booked 30 out of 31 available nights across 5 bookings — 97% occupancy. The channel mix included Airbnb, Booking.com, and direct bookings via cabobali.com. Average published rate was approximately $174/night.
Direct bookings are a meaningful part of our channel strategy — they avoid the 15–17% OTA commission entirely, which directly improves owner margin. Building a direct booking channel takes time and brand investment, but it’s one of the highest-leverage things a management company can do for your yield. Most managers don’t bother. We prioritise it.
The standout this month: a single 21-night booking at the villa’s top rate generated roughly 75% of the month’s total revenue. Long stays at strong rates are where the real yield lives — they reduce turnover costs (fewer cleans, fewer check-ins, less wear), and they generate review-worthy experiences because the guest has time to actually enjoy the villa.
How This Compares to the Market
AirDNA benchmarks the South Kuta/Bukit Peninsula market at:
- RevPAR: ~$55/night
- Occupancy: 70%
- ADR: ~$90/night
This villa runs at:
- RevPAR: above $160 (in recent months)
- Occupancy: 96% annual (on available nights)
- ADR: $147 average in 2025, trending $170+ in recent months
The outperformance is real — but it’s conditional. This villa is well-built, well-located, well-photographed, and actively managed with dynamic pricing and multi-channel distribution. The submarket (Uluwatu clifftop) provides the rate ceiling; execution determines whether you reach it.
A 1-bed villa in Uluwatu with average photos, static pricing, and single-channel distribution would not produce these numbers.
Why Direct Bookings Change Everything
Most villa management companies in Bali are entirely dependent on OTAs. Every booking comes through Airbnb or Booking.com, every dollar of revenue is subject to their commission, their policies, and their leverage.
That’s a problem — and not just because of the 15–17% commission.
OTAs have leverage over your villa. When a guest complains on Airbnb, the platform can issue refunds from your payout without your approval. When Airbnb changes its review algorithm, your ranking can shift overnight. When Booking.com adjusts commission rates — which they do — your margin compresses with no negotiation. When an OTA decides to favour hotels over villas in search results, your visibility drops and there’s nothing you can do about it.
Every booking that comes through your own direct channel removes that leverage entirely. The guest pays you directly. The review lives on your terms. The refund decision is yours, not the platform’s. And the 15–17% commission stays in your pocket.
This is why we push direct bookings hard. It’s not just a margin play — it’s a risk-reduction strategy. The more of your revenue that flows through your own channel, the less exposed you are to platform decisions that you don’t control and can’t predict.
We invest in building each villa’s direct booking presence through cabobali.com — professional listing pages, direct booking incentives (guests save vs OTA pricing), and a guest experience that drives repeat bookings and referrals outside the platform ecosystem.
Pro tip for owners. Ask your management company what percentage of your bookings come through direct channels. If the answer is zero — or if they don’t have a direct booking channel at all — every dollar of your revenue is subject to OTA commission, OTA refund policies, and OTA algorithm changes. The more you push direct bookings, the more you protect your villa’s profits and reduce your exposure to platform risk. This is one of the clearest signals of whether your manager is working in your interest or just listing you on Airbnb and waiting.
What Most Sales Decks Get Wrong
If a broker showed you this villa before purchase, their sales deck would probably have projected 80% occupancy at $180 ADR, with expenses hand-waved at "approximately 20–30% of revenue." That would give you a projected owner profit well above what the actual result was.
The gap isn’t because the villa underperformed — it significantly outperformed the market benchmark. The gap exists because sales decks systematically understate OTA commissions, forget about maintenance reserves, ignore the months where things go wrong, and assume every month performs like August.
This is why we publish real numbers. Not to discourage investment — the returns here are genuinely strong at 14% net yield. But to set the expectation correctly so that year one doesn’t feel like a disappointment when it’s actually a success.
Pro tip for buyers. Ask your broker to show you performance data like this — 12 months, occupancy and margins, the bad months included. Not a projection. Not a model. Actual historical performance from a comparable villa managed by a real operator. If they can’t produce it, treat their projections with appropriate skepticism. See a full breakdown of what each cost category covers →
Why the Forward Numbers Should Be Stronger
Three things that won’t repeat in 2026:
- Owner stay (April): A full month off the market. Perfectly normal — no restrictions on owner use — but it reduced the revenue baseline.
- Expense clustering (June): A pump replacement and annual service renewals landing in the same period. One-time stacking.
- Neighbouring construction (July): Now complete.
Strip those out and the normalised margin moves from 51% to 57–60% of gross. On a $200–250K acquisition, that’s a 14% net yield. That’s the number we expect going forward, and the recent months are tracking to confirm it.
Key takeaways
- This real 1-bed Uluwatu villa returned a 14% net yield on a $200–250K acquisition — from actual owner reports, not a projection.
- It ran 96% occupancy on available nights at a $147 average ADR (trending $170+), versus the AirDNA Bukit Peninsula benchmark of ~70% occupancy and ~$90 ADR.
- The owner kept 51% of gross in 2025 (a year with owner use and clustered expenses) and a normalised 57–60% going forward.
- Direct bookings via cabobali.com avoid the 15–17% OTA commission entirely — the single highest-leverage lever on owner margin.
- Judge a villa on the annual picture, not its worst month — costs cluster, and one bad month doesn’t define performance.
FAQ
Is 14% net yield realistic for a 1-bed in Uluwatu?
On a $200–250K acquisition with proper management, yes. This is actual performance, not projected. Even in 2025 — a year with a month of owner use and some elevated expense months — the villa returned 14% net.
Why did you issue partial refunds to some guests?
Because protecting a 5-star review protects the villa’s nightly rate for every booking that follows. A small partial refund is always cheaper than a lower ADR for the next 50 bookings.
What happened in June?
A pump replacement landed in the same period as annual service renewals — costs that would normally spread across the year clustered in one month. Margin compressed to 52% that month but the annual picture absorbed it comfortably.
Can the owner still use the villa?
Yes. No restrictions on owner stays, no commission charged on personal use. The admin fee still applies because the team continues maintaining the property.
What channels generate the bookings?
Airbnb, Booking.com, Trip.com, and direct bookings via cabobali.com. We actively build the direct booking channel because every direct booking saves the owner 15–17% in OTA commissions — that’s pure margin improvement.
What would more direct bookings do to the margin?
Significant impact. OTA commissions run 16–17% of gross. Shifting more bookings to direct reduces the blended commission rate and adds thousands per year in pure margin. This is one of the highest-leverage things we do for owners.
Is this villa’s performance typical of Cabo’s portfolio?
This villa performs in line with our portfolio average for 1-bed Uluwatu properties. We manage villas at 91% average occupancy across the portfolio — this villa sits in that range.
If You Own a Villa in Uluwatu
If you’re reading this and your 1-bed isn’t hitting these numbers, the question isn’t whether the market supports it — it does. The question is what’s holding your villa back: pricing, photography, channel mix, operational standards, or management.
We’re happy to look at your current performance and give you an honest read on where the gap is. No pitch. No pressure. Just the data.
About the author. Keanu Fischell is co-founder of Cabo Bali, which manages 20+ boutique villas across Uluwatu, Bingin and Canggu. He writes from the operator's side of Bali villas — real numbers, real guest feedback, and lessons from running the portfolio day to day.
Related reading:
- How Much Does Bali Villa Management Cost? A Full 2026 Breakdown
- Best Villa Management Companies in Bali 2026
- How We Hit 91% Occupancy in Under 3 Months
- Bukit Peninsula Villa Investment: What Actually Returns (2026)
- How to Choose a Villa Management Company in Bali
Sources & References
The performance figures in this guide come from Cabo Bali’s own 2025–2026 owner reports for the villa profiled. Market benchmarks and methodology are anchored to the independent sources below.
- AirDNA — Bali / Bukit Peninsula short-term rental market data (South Kuta / Bukit benchmark: ~70% occupancy, ~$90 ADR, ~$55 RevPAR; accessed April 2026).
- PriceLabs — dynamic pricing engine used to set this villa’s nightly rates.
- Airbnb Help Center — service fees (basis for the 15–17% OTA commission range).
- Booking.com Partner Hub — commission and payment terms.
- Trip.com Partner — distribution channel terms.
- BPS Bali (Statistics Indonesia) — Bali tourism and accommodation occupancy statistics.
- Bali Hotels Association — accommodation market context.
- Horwath HTL — Indonesia hospitality market reports.
- Colliers Indonesia — hospitality and real-estate research.
- STR (CoStar) — RevPAR and occupancy methodology.
- Bank Indonesia — Rupiah settlement requirement for transactions in Indonesia.
- Cabo Bali — Lago Villas case study (Bingin) — comparable portfolio performance.
All villa figures are from actual Cabo Bali owner reports (2025–2026), presented in approximate USD for international readability; transactions are priced and settled in IDR. AirDNA South Kuta / Bukit Peninsula market data current as of April 2026. Cabo Bali is a villa management company, not a legal, tax, or financial advisor — engage independent licensed advisors before any investment decision.