%20(1).avif)
By Keanu Fischell, Co-Founder, Cabo Bali
Data sourced from PriceLabs (past 90 days) and AirDNA (South Kuta/Bukit Peninsula, Luxury tier, 4.9★, 1BR filter).
Period: December 2025 – February 2026.
The Short Version
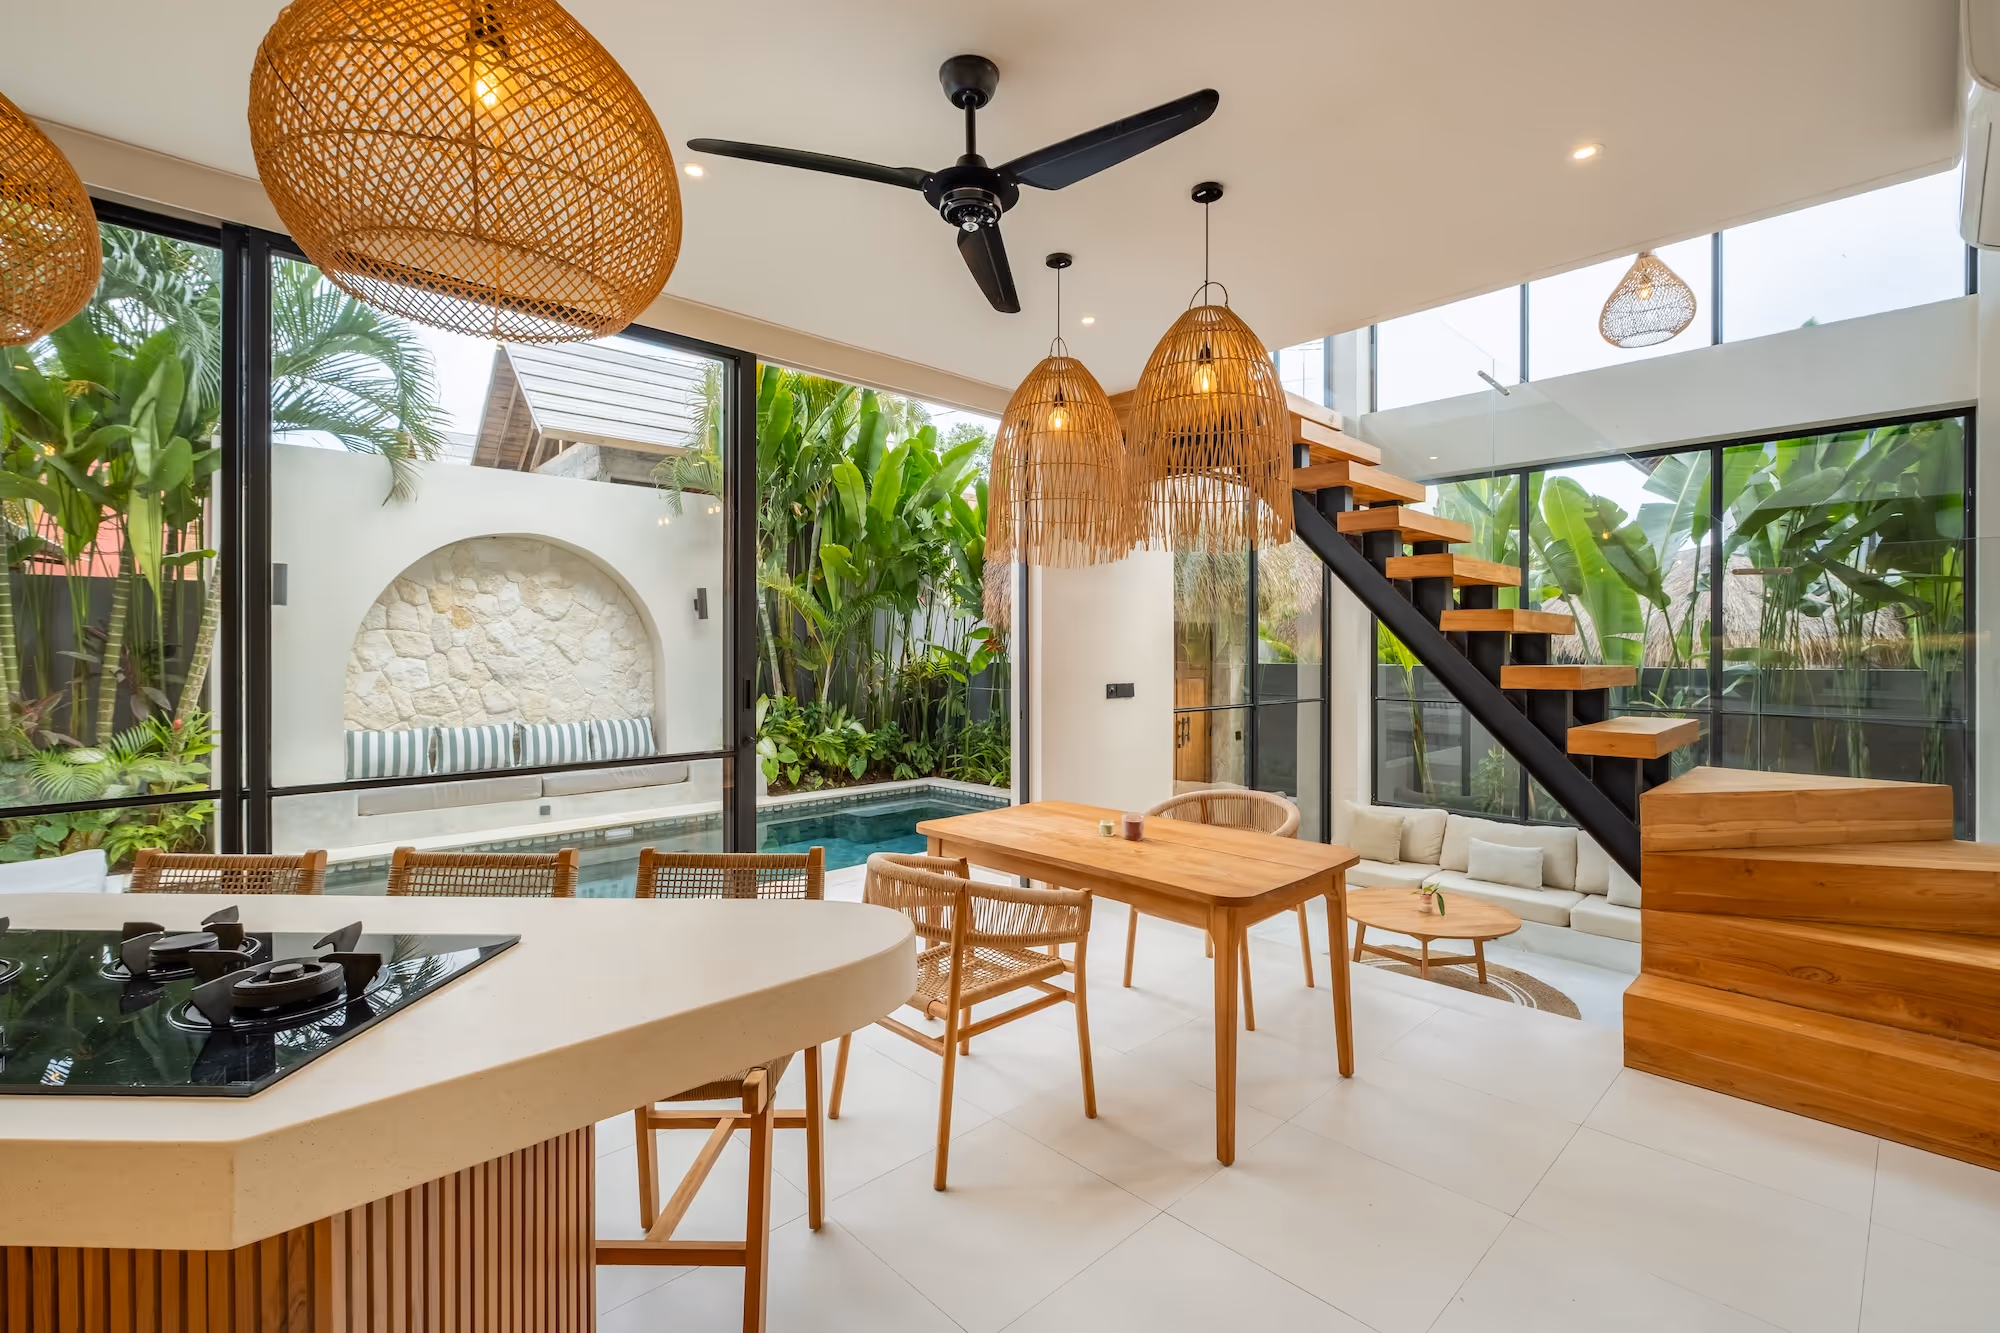
Lago Villas is a 1BR villa complex in Bingin. We benchmarked its performance against the top tier of the AirDNA market data — Luxury, 4.9★ rated, 1BR properties across the South Kuta/Bukit Peninsula. The result over the past 90 days:
| Metric | Lago Portfolio Avg | Luxury 4.9★ Benchmark | Difference |
|---|---|---|---|
| Occupancy | 96% | 67.87% | +41% ✓ |
| ADR | $129.25 | $145.20 | −10.98% |
| RevPAR | $124.50 | $98.54 | +26.34% ✓ |
Lago outperforms the top tier of the market on RevPAR — the metric that determines how much money an owner actually makes — by 26%. And it did this while managing active construction on the neighbouring property.
.jpg)
Understanding the AirDNA Tiers
AirDNA segments short-term rental properties into five price tiers based on nightly rate positioning in each market:
- Budget ($) — entry-level pricing, basic amenities
- Economy ($$) — below midmarket, value-focused
- Midscale ($$$) — mid-market pricing
- Upscale ($$$$) — above midmarket, quality amenities and design
- Luxury ($$$$$) — top tier of the market, premium rates, typically 4.8★+
Lago Villas sits in the Upscale tier. We chose to benchmark against Luxury — the tier above — because it's the hardest comparison available and because it produces the most honest picture of what's actually possible in this market.
Comparing against the overall average would widen the gap considerably. We'd rather show you the hardest benchmark we beat than the easiest one.

The Luxury 4.9★ filter represents the best-reviewed, highest-priced 1BR properties on the Bukit Peninsula.
Why This Comparison Is Deliberately Hard
Benchmarking Upscale properties against Luxury isn't standard practice. Most management companies compare against the market average. We do this for a specific reason: if you're managing a property well, the market average is the wrong benchmark. The question isn't 'are we better than the median?' — it's 'are we extracting the maximum possible value from this asset?'
The AirDNA Luxury 4.9★ benchmark for the South Kuta/Bukit Peninsula over this period:
| Month | Occupancy | ADR | RevPAR | Notes |
|---|---|---|---|---|
| Feb 2026 | 72.30% | $134 | $96.90 | |
| Jan 2026 | 67.60% | $146.40 | $99.00 | |
| Dec 2025 | 63.70% | $155.20 | $98.90 | |
| 90-day avg | 67.87% | $145.20 | $98.54 | Benchmark used |
These are the best-reviewed properties in the market. We're beating them on RevPAR by 26%.

The Context: Construction Next Door
In late 2025, construction began on the property directly adjacent to Lago Villas. In Bingin — a dense, walkable hillside village where villas sit close together — this is a real challenge. Noise, visual disruption, and the instinct to either warn guests heavily or ignore it entirely.
Both of those instincts are wrong, and we've tested both.
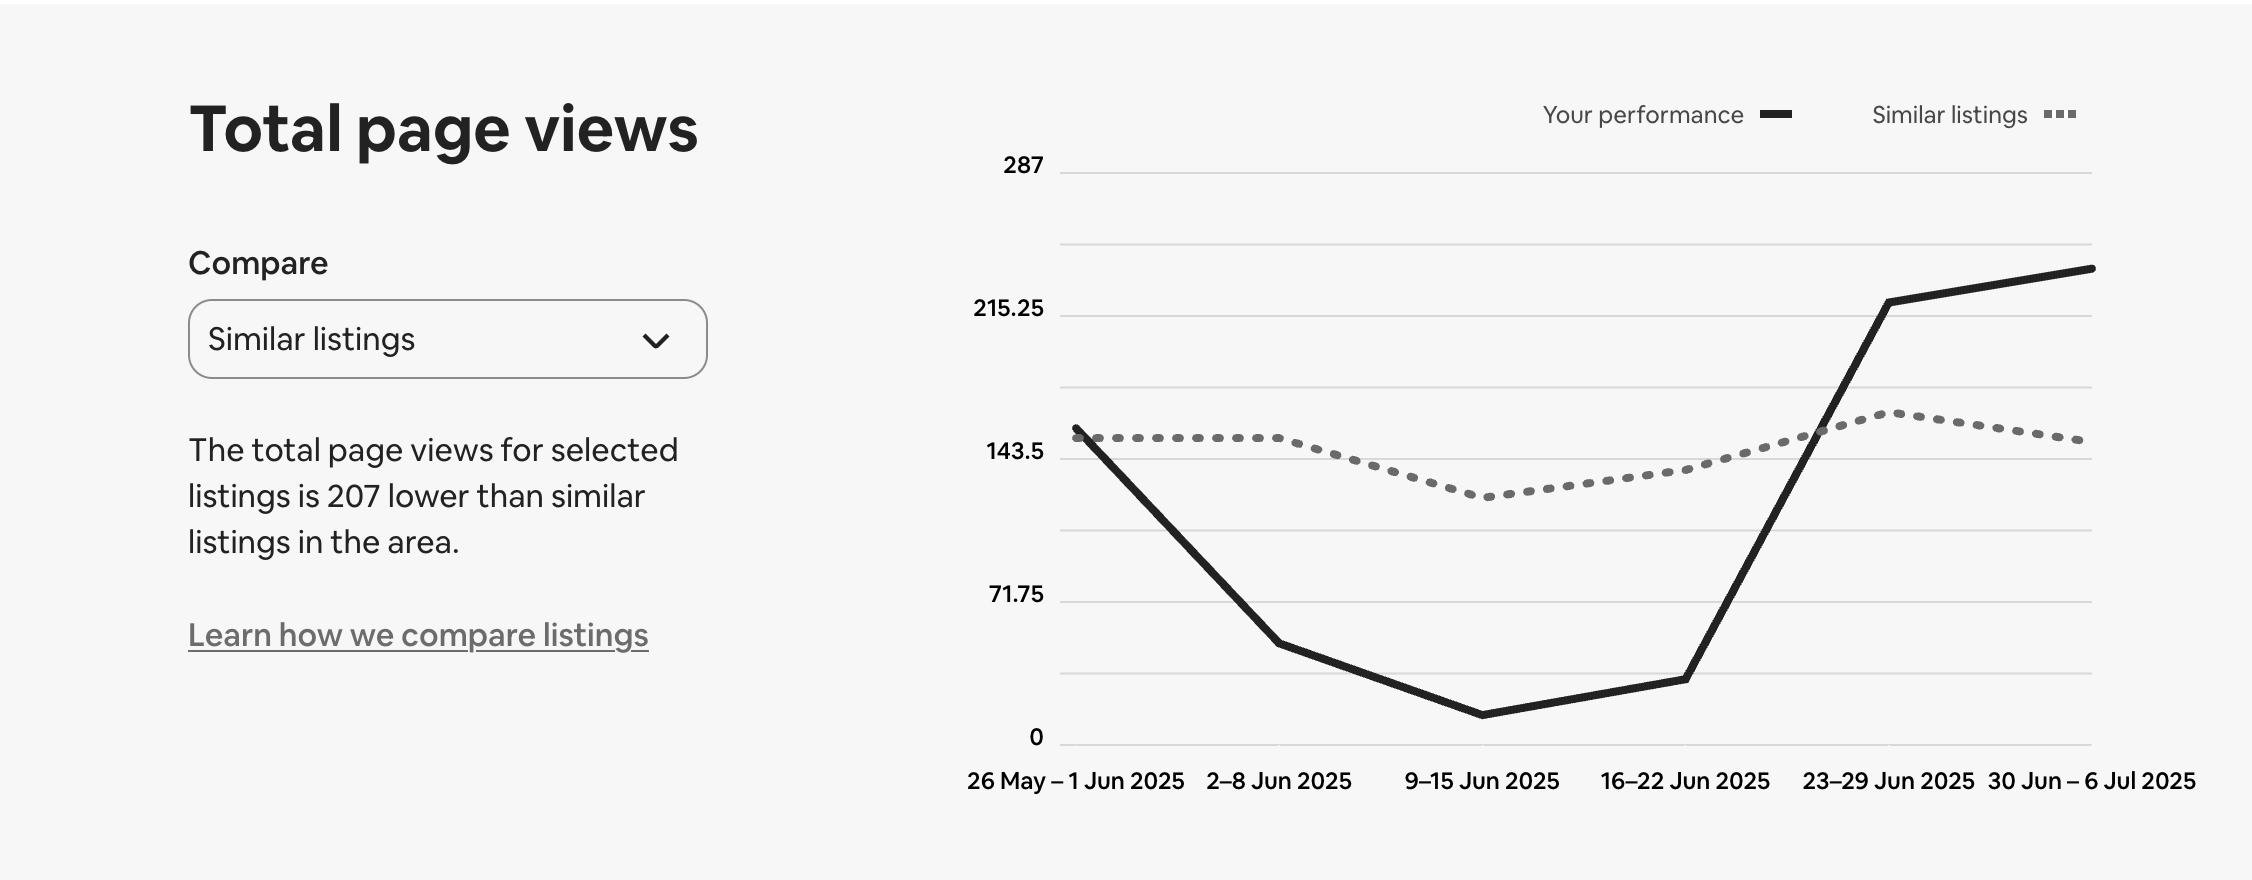
Pro tip: How you word it makes the world of difference. We tested calling out the construction prominently at the top of the listing. The framing we used essentially said: this isn't our fault, it's not our responsibility. Within days, Airbnb page views dropped to near zero — the algorithm demoted the listing as conversion rate collapsed. Similar listings in the area held steady at ~143 views per week. We hit 7. The recovery came once we rewrote the copy — same information, completely different framing. Acknowledge the construction matter-of-factly. Own it. Don't deflect. Guests who book knowing about it arrive with accurate expectations and don't leave reviews mentioning it. Guests who feel misled do. And Airbnb's algorithm watches your conversion rate closely — distancing language that kills bookings will get you demoted faster than the construction itself ever would.
Ignoring it entirely means guests who weren't expecting it mention it in reviews, which compounds into a review streak that suppresses future bookings algorithmically.
The approach that works: acknowledge it matter-of-factly in the listing — enough that guests aren't surprised, not so prominently that it becomes the headline of what they're booking. Set accurate hours. Let the villa sell itself on what it actually delivers.
The Lago portfolio maintained 96% adjusted occupancy through this period.

How the Performance Gap Is Built
There are four things that explain why the numbers look the way they do. None of them are secrets. All of them require consistent work.
1. Finding the Balance Between ADR and Occupancy
The ADR gap against the Luxury benchmark — $129 vs $145 — is deliberate. At 96% occupancy, the portfolio is running close to the mathematical ceiling of what's possible. The question then becomes: can we push ADR toward the benchmark without eroding that occupancy advantage?
That's exactly what the March 2026 pricing audit was designed to address — raising the price ceiling, adding Friday/Saturday premiums, tightening the discount stack. The goal is to close the ADR gap through peak season (June–August) while holding occupancy above 90%.
The mistake many operators make is treating ADR as the primary target. High rates with empty nights produce poor owner returns. RevPAR — the product of rate and occupancy together — is the only number that tells you whether the balance is right.
2. Dynamic Pricing — Managed, Not Just Automated
PriceLabs handles the algorithmic layer. But the software's default settings, applied without regular human review, will routinely erode revenue through discount rules that stack in ways you didn't intend.
The most common problem we see on villas we take over: last-minute discounts, orphan day discounts, occupancy-based adjustments, and monthly discounts all running simultaneously — with a price ceiling so tight the upside algorithm is effectively switched off. The result is a villa that gets booked but consistently at $80–90 per night when demand would have supported $130–140.
Weekly review of every active pricing rule — checking for stacking effects, adjusting for upcoming demand signals, and recalibrating around market movement — is what separates managed dynamic pricing from automated price suppression.

3. Listings Built Around Guest Conversion
Lago Villas guests have typically shortlisted 4–5 properties before booking. The listing's job is to convert browsers who are already interested — not just to appear in search results.
That means description copy written around what the stay actually feels like, not a checklist of what's included. It means titles optimised for search visibility. It means a hero photo chosen for thumbnail performance in Airbnb search results. And it means we track which images convert and update them when they stop performing.
4. Review Strategy
Lago maintains a 4.9★ average. In the Bukit Peninsula's competitive 1BR market, the difference between 4.7★ and 4.9★ is not cosmetic. AirDNA market data suggests that 4.9★ properties command meaningfully higher ADRs than 4.7★ equivalents at similar occupancy levels.
Review performance is managed actively: personalised checkout messages, in-stay issue resolution where possible, and proactive monitoring for patterns that signal a guest experience problem before it becomes a review problem.
What We Learned
RevPAR is the only metric that tells the truth.
High occupancy at a suppressed rate, or a high rate with empty nights — both can look like success and both can mask underperformance. RevPAR is the single number that owners should hold their management company accountable to.
Benchmark against the top tier, not the average.
The market average for Luxury 4.9★ 1BR properties on the Bukit Peninsula is 67.87% occupancy and $98.54 RevPAR. Beating those numbers by 26% on RevPAR — from a property classified one tier below — is the real story. If your management company benchmarks against the overall market average, ask them why.
Construction doesn't have to cost you a season.
The playbook is specific: calibrate the communication level carefully, let the villa's actual quality do the work, and maintain pricing discipline rather than defaulting to heavy discounting. We held 96% occupancy through active construction. That's a repeatable outcome, not an accident.
Optimisation is continuous, not a setup task.
The pricing rules, the listing copy, the channel strategy — all of it degrades if it's not actively maintained. The properties in this portfolio that perform best are the ones with the most consistently reviewed settings.
The ADR Opportunity Ahead
The March 2026 pricing audit raised the price ceiling, added day-of-week premiums for peak demand, and tightened the discount stack. As those changes compound through the upcoming peak season (June–August) and holiday periods, we expect the ADR gap against the Luxury benchmark to close meaningfully — without sacrificing the occupancy advantage that drives the RevPAR outperformance.
Once the neighbouring construction completes, the listing copy and base pricing can both be reset upward. Properties operating under construction constraints typically show an 8–12% lift in base rates when that constraint is removed.
We'll publish an updated version of this case study in Q3 2026 with the full 12-month picture.
What This Means for Your Villa
If you own a villa in Bali, the Luxury 4.9★ benchmark is your ceiling reference. The best-reviewed, most competitive 1BR properties in your market are running at $98.54 RevPAR. Our portfolio is at $124.50.
The gap between average management and intentional management — measured against the top tier of the market — is approximately $26 RevPAR per night ($124.50 − $98.54). On a well-occupied 1BR villa running 330 available nights per year, that compounds to roughly $8,500–9,500 in additional annual owner revenue.
That's the number any management company should be able to justify — or explain why their properties aren't achieving it.
Own a villa in Bali? We'd be happy to run a free benchmarking analysis for your property against the same AirDNA dataset used here. Get in touch →
Data covers December 2025 – February 2026. Property performance sourced from PriceLabs. Market benchmarks sourced from AirDNA (South Kuta/Bukit Peninsula, Luxury tier, 4.9★ rating, 1BR filter).
Key takeaways
- RevPAR is the truth-teller. Rate × occupancy is the only metric that reflects what an owner actually earns — hold your manager to it, not to ADR or occupancy alone.
- Lago beat the top tier. 96% occupancy and $124.50 RevPAR — +26% RevPAR versus the AirDNA Luxury 4.9★ 1BR benchmark ($98.54), from a villa classed one tier below it.
- It held through construction. 96% occupancy was maintained during active construction next door by framing it honestly rather than defensively.
- The gap is built, not lucky. Managed (not just automated) PriceLabs, conversion-built listings, and active review management compound into the outperformance.
- What it's worth: the ~$26/night RevPAR edge ≈ $8,500–9,500 in extra owner revenue per year on a 1BR.
Frequently asked questions
How did Lago Villas perform versus the market?
Over December 2025–February 2026, Lago Villas averaged 96% occupancy and $124.50 RevPAR, beating the AirDNA Luxury 4.9★ 1BR benchmark for the South Kuta/Bukit Peninsula (67.87% occupancy, $98.54 RevPAR) by 26% on RevPAR — the metric that determines owner income.
What is RevPAR, and why does it matter more than ADR or occupancy?
RevPAR (revenue per available night) is ADR multiplied by occupancy. A high nightly rate with empty nights, or high occupancy at a suppressed rate, can both look like success while hiding underperformance. RevPAR is the single number that reflects what an owner actually earns.
Why benchmark an Upscale villa against the Luxury tier?
It is deliberately the hardest available comparison. Lago sits in AirDNA's Upscale tier; we benchmark against the Luxury tier above it because beating the market average is easy and uninformative. Beating the top tier shows the real value intentional management adds.
How did construction next door affect bookings?
Lago held 96% adjusted occupancy through active construction by acknowledging it matter-of-factly in the listing rather than deflecting. Defensive "not our fault" wording collapsed conversion and got the listing demoted by Airbnb's algorithm; honest, calibrated framing kept bookings and reviews intact.
How much extra revenue does intentional management produce?
The gap between Lago and the Luxury benchmark is about $26 RevPAR per night ($124.50 − $98.54). On a 1BR villa running roughly 330 available nights a year, that compounds to approximately $8,500–9,500 in additional owner revenue annually.
Can Cabo Bali benchmark my villa?
Yes. Cabo Bali offers a free, no-obligation benchmarking analysis of your property against the same AirDNA dataset used here. Cabo manages 20+ boutique villas across Uluwatu, Bingin and Canggu.
Sources & References
External benchmarks and definitions in this case study draw on the following authoritative sources. Cabo's portfolio figures are sourced from PriceLabs; market benchmarks from AirDNA.
- AirDNA — Bali / Bukit Peninsula short-term-rental market data and price-tier benchmarks (Luxury 4.9★, 1BR filter) used for the comparison.
- PriceLabs — dynamic-pricing platform; source of the Lago portfolio performance data (past 90 days).
- Airbnb Help Center — how search ranking and conversion rate affect a listing's visibility.
- Booking.com Partner Hub — ranking and visibility factors for accommodation partners.
- Wheelhouse — revenue-management benchmarks for short-term rentals.
- BPS Bali (Statistics Indonesia, Bali Province) — Bali tourism arrivals and accommodation occupancy statistics.
- Bali Hotels Association — Bali accommodation-market performance commentary.
- Horwath HTL — Asia-Pacific hotel and tourism market reports.
- Colliers — Indonesia and Bali hospitality and real-estate market research.
- STR (CoStar) — global hotel performance benchmarking and standard ADR / occupancy / RevPAR definitions.
- Cabo Bali — Lago Villas — the property collection under analysis.
About the author. Keanu Fischell is co-founder of Cabo Bali, which manages 20+ boutique villas across Uluwatu, Bingin and Canggu. He writes from the operator's side of Bali villas — real numbers, real guest feedback, and lessons from running the portfolio day to day.

.jpeg)